Designing a Scalable & Fault-Tolerant Log Pipeline [Part 4]: Extract INFO from ERRORS
Flink, Nessie, Iceberg, and Trino as a long-term log archive and the SQL queries that turn months of error history into actionable signals.
This is Part 4 of a series on building a scalable, fault-tolerant log pipeline.
- Part 1 covered agents and forwarders.
- Part 2 covered the buffer layer.
- Part 3 covered the storage decision: hot vs cold, and why VictoriaLogs is still working on production-ready S3 support (PR #1155).
This part covers the cold storage path that fills that gap. VictoriaLogs handles hot search today: sub-10s ingestion to Grafana, fast recent log search. But without native S3 support, cold data has nowhere to go. The Flink → Nessie → Iceberg → RustFS path is what we built while waiting. Five more components to operate. In return: full SQL on months of structured log history, open format, and column-oriented reads that scale with the data.
We’ll also look at how this compares when Loki fetches from S3, and ClickHouse with S3 tiering, which is simpler if you’re not already running Flink.
Agents → Forwarders → Kafka → Flink → Nessie + Iceberg → RustFS → TrinoLayer 4: Long-Term Log Analytics#
What happens after Kafka#
One topic o11y.logs.v1 feeds three independent consumer groups. Each reads at its own speed, with no awareness of the others.
o11y.logs.v1
│
├── o11y.logs.archive    → Flink archives to Iceberg on RustFS
│   └── Data lands in Trino:  2-5 min after Kafka ingest
│
├── o11y.logs.correlate  → Flink joins logs + metrics in 2-min windows
│   └── Correlated events:    ~2 min detection latency
│
└── o11y.logs.search     → VictoriaLogs ingests for hot search
    └── Available in Grafana: <10 sec from ingest
This post focuses on o11y.logs.archive. The 2-5 min lag to Trino is a deliberate trade-off.
How Flink reads from Kafka#
The Flink SQL job reads the Kafka topic as raw UTF-8 strings, one string per message, with the complete original JSON preserved in raw_json. Nothing is discarded at read time.
SET 'execution.checkpointing.interval' = '3 min';

CREATE TABLE IF NOT EXISTS o11y_logs_source (
    `raw_json` STRING,
    `event_time` AS TO_TIMESTAMP(
        REPLACE(SUBSTRING(COALESCE(
            JSON_VALUE(`raw_json`, '$.time'),
            JSON_VALUE(`raw_json`, '$.[''@timestamp'']')
        ), 1, 19), 'T', ' ')
    ),
    WATERMARK FOR `event_time` AS `event_time` - INTERVAL '10' SECOND
) WITH (
    'connector'                    = 'kafka',
    'topic'                        = 'o11y.logs.v1',
    'properties.bootstrap.servers' = 'kafka1:9092,kafka2:9092,kafka3:9092',
    'properties.group.id'          = 'o11y.logs.archive',
    'scan.startup.mode'            = 'group-offsets',
    'properties.auto.offset.reset' = 'earliest',
    'format'                       = 'raw',
    'raw.charset'                  = 'UTF-8'
);
format = 'raw' reads each Kafka message as a single string into raw_json. Nothing is parsed or dropped at read time. The correlation job uses format = 'json': typed columns at read time, everything else dropped. Right for stable schemas and real-time joins. The archive needs the opposite because the schema is not fixed, and dropping fields from a payload you want to keep for years is the wrong trade-off.
One pattern worth knowing as you add more Flink jobs: use the Kafka record timestamp as the watermark instead of parsing one from the payload.
`kafka_ts` TIMESTAMP_LTZ(3) METADATA FROM 'timestamp',
WATERMARK FOR `kafka_ts` AS `kafka_ts` - INTERVAL '10' SECOND
METADATA FROM 'timestamp' is always present, never NULL, no ISO 8601 parsing required. The trade-off is ingest time vs event time as the window boundary. For a pipeline where the forwarder-to-Kafka lag is under 2 seconds, the difference is negligible. You keep event_time parsed from the payload as a best-effort column for filtering and partitioning; kafka_ts just drives the watermark reliably. That’s the next iteration we plan to test on this job.
What Flink extracts#
A temporary view o11y_logs_enriched reads from o11y_logs_source and extracts typed columns from raw_json, keeping the original payload intact:
CREATE TEMPORARY VIEW o11y_logs_enriched AS
SELECT
    event_time,
    JSON_VALUE(`raw_json`, '$.log')               AS `log`,
    JSON_VALUE(`raw_json`, '$.service_name')      AS service_name,
    JSON_VALUE(`raw_json`, '$.service_namespace') AS service_namespace,
    JSON_VALUE(`raw_json`, '$.host_name')         AS host_name,
    -- ... 10 more identity columns
    COALESCE(
        JSON_VALUE(`raw_json`, '$.log_level'),
        JSON_VALUE(`raw_json`, '$.level'),
        CASE
            WHEN LOWER(JSON_VALUE(`raw_json`, '$.log')) LIKE '%error%' THEN 'error'
            WHEN LOWER(JSON_VALUE(`raw_json`, '$.log')) LIKE '%warn%'  THEN 'warning'
            ELSE 'info'
        END
    ) AS log_level,
    `raw_json`
FROM o11y_logs_source;
log_level is inferred from message content when the field is absent, so logs that don’t emit a structured level still get classified.
o11y_logs_source      — Kafka, raw_json string
        ↓
o11y_logs_enriched    — view, typed columns + raw_json
        ↓
o11y_iceberg.logs.o11y_logs  — Iceberg table on RustFS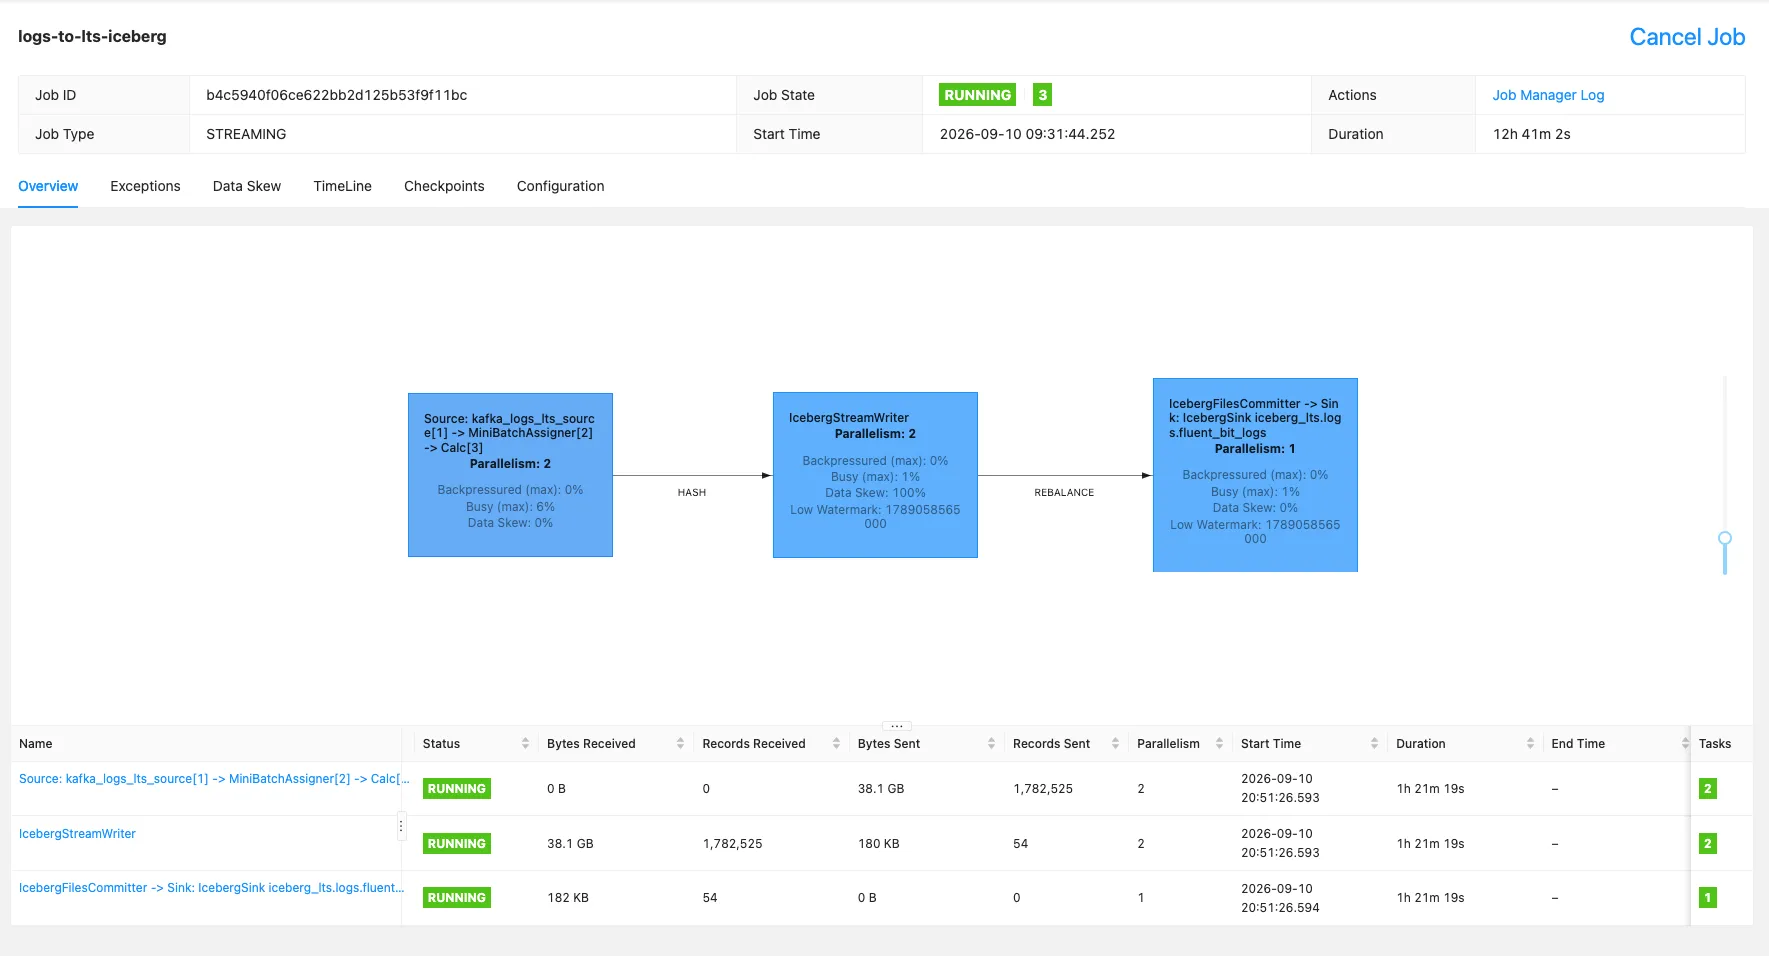
Why the schema follows your platform#
The schema reflects what the infrastructure actually produces. Every Docker container in this homelab uses the fluentd logging driver:
logging:
  driver: fluentd
  options:
    fluentd-address: "127.0.0.1:24224"
    tag: "docker.{{.Name}}"
    labels: "service.name,service.namespace,fluentbit.exclude"
Docker attaches the container labels to every log entry before it reaches Fluent Bit. service.name becomes service_name, service.namespace becomes service_namespace. Fluent Bit adds host_name, host_ip, and the container stream (stdout/stderr). The remaining columns (env, site_name, job, log_source, log_type, source) are enrichment fields added by the Fluent Bit pipeline for multi-site setups.
On Kubernetes, the equivalent comes from pod annotations and the kubelet: pod_name, namespace, node_name, container_name. The pattern is the same. Check what metadata your log agent is already attaching before designing the Iceberg schema. The table structure should match the labels in your platform, not the other way around.
This matters because Iceberg partition pruning and column projection only help if the columns you filter on exist as typed columns. A service_name stored as a STRING column is a partition predicate candidate. The same value buried inside raw_json requires a full scan to filter.
Writing to Iceberg#
CREATE TABLE IF NOT EXISTS o11y_iceberg.logs.o11y_logs (
    `event_time`        TIMESTAMP(3),
    `log`               STRING,
    `stream`            STRING,
    `service_name`      STRING,
    `service_namespace` STRING,
    `component`         STRING,
    `host_name`         STRING,
    `host_ip`           STRING,
    `env`               STRING,
    `site_name`         STRING,
    `job`               STRING,
    `log_source`        STRING,
    `log_type`          STRING,
    `source`            STRING,
    `log_level`         STRING,
    `raw_json`          STRING,  -- complete original Kafka payload
    `dt`                STRING,
    `hr`                STRING
) PARTITIONED BY (`dt`, `hr`)
WITH (
    'write.parquet.compression-codec'    = 'zstd',
    'write.target-file-size-bytes'       = '134217728',  -- 128 MiB
    'write.parquet.row-group-size-bytes' = '33554432'    -- 32 MiB
);
SET 'pipeline.name' = 'o11y-logs-to-iceberg';
INSERT INTO o11y_iceberg.logs.o11y_logs
SELECT
event_time, `log`, `stream`, service_name, service_namespace,
component, host_name, host_ip, env, site_name, job,
log_source, log_type, source, log_level, raw_json,
DATE_FORMAT(event_time, 'yyyy-MM-dd') AS dt,
DATE_FORMAT(event_time, 'HH') AS hr
FROM o11y_logs_enriched;Reliability and data loss#
Exactly-once delivery is guaranteed by two mechanisms working together:
- Kafka offset commits happen only when a Flink checkpoint succeeds
- Iceberg file commits are atomic through Nessie (PostgreSQL transaction)
If the job crashes mid-checkpoint, Flink restarts from the last successful checkpoint and re-reads the uncommitted Kafka offsets. Readers never see partial writes.
What actually causes data loss:
- Kafka retention expires before
o11y.logs.archivecatches up messages are gone before Flink reads them - RustFS runs out of disk space checkpoint fails silently, job keeps running
- ISO 8601 timestamp issue records land with NULL
event_time, watermarks never advance, files never close
The checkpoint interval and archival lag#
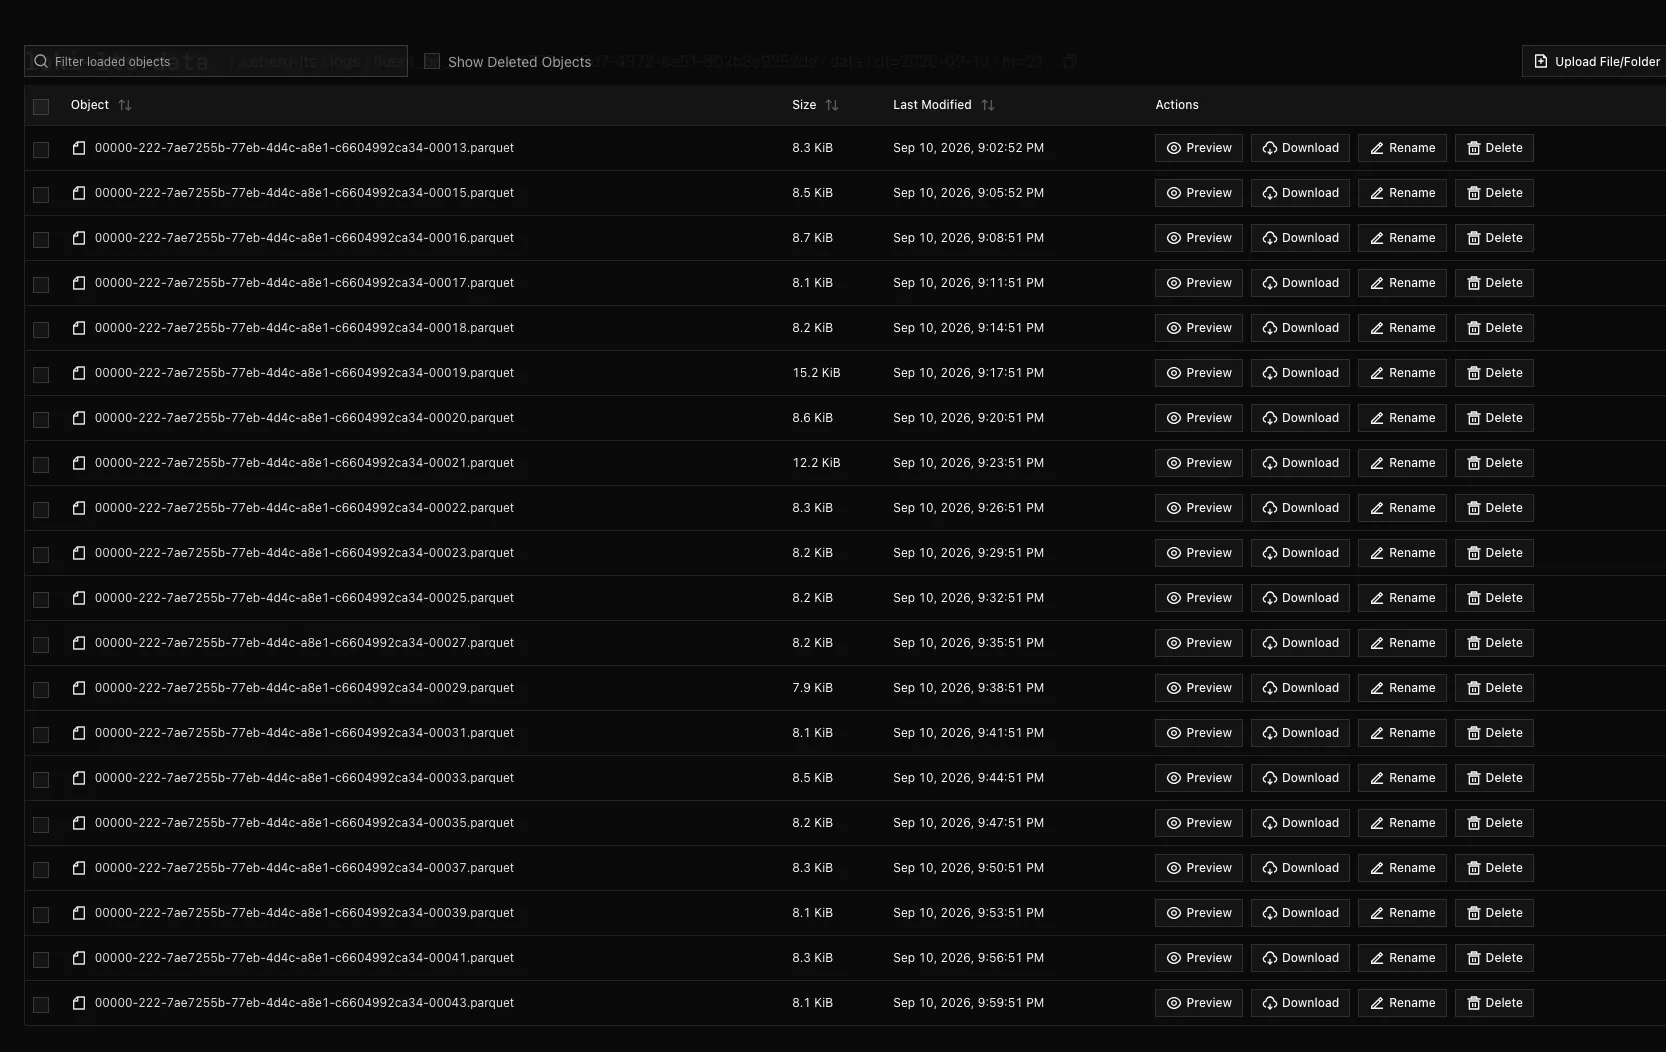
Each checkpoint closes the current Parquet file and commits a new Iceberg snapshot. The checkpoint interval is the main lever:
| Interval | File size | Lag to Trino | Trade-off |
|---|---|---|---|
| 1 min | Many small files | ~1-2 min | More S3 API calls, worse compression |
| 3 min | 50-128 MiB | ~3-6 min | Balance point for this setup |
| 10 min | Fewer, larger files | ~10-15 min | Best storage, slowest visibility |
Target file size is configured at 128 MiB (write.target-file-size-bytes = 134217728). When throughput is low, files may close smaller. That’s the small file problem covered in the operational section.
Nessie + Iceberg: catalog and format#
S3 has no atomic rename. Without a catalog, committing an Iceberg table under concurrent writes requires distributed locks that fail unpredictably.
Nessie stores commit metadata in PostgreSQL. A write from Flink becomes a database transaction: atomic, consistent, immediately visible to Trino. The Parquet files go to RustFS; the manifest of which files belong to which snapshot stays in Postgres.
# From: nessie/application.properties
nessie.version.store.type=JDBC2
nessie.catalog.default-warehouse=logs
nessie.catalog.warehouses.logs.location=s3://o11y-archive/iceberg
nessie.catalog.service.s3.default-options.endpoint=http://10.0.5.191:7000/
nessie.catalog.service.s3.default-options.path-style-access=true
Iceberg anatomy
Snapshot (every 3-min checkpoint)
  └── Manifest list
        ├── Manifest A  [dt=2026-09-01, hr=14]
        │     ├── data-14-0001.parquet  [min: 14:00, max: 14:59, rows: 2.1M]
        │     └── data-14-0002.parquet  [min: 14:00, max: 14:32, rows: 890K]
        └── Manifest B  [dt=2026-09-01, hr=15]
              └── data-15-0001.parquet  [min: 15:00, max: 15:58, rows: 1.8M]
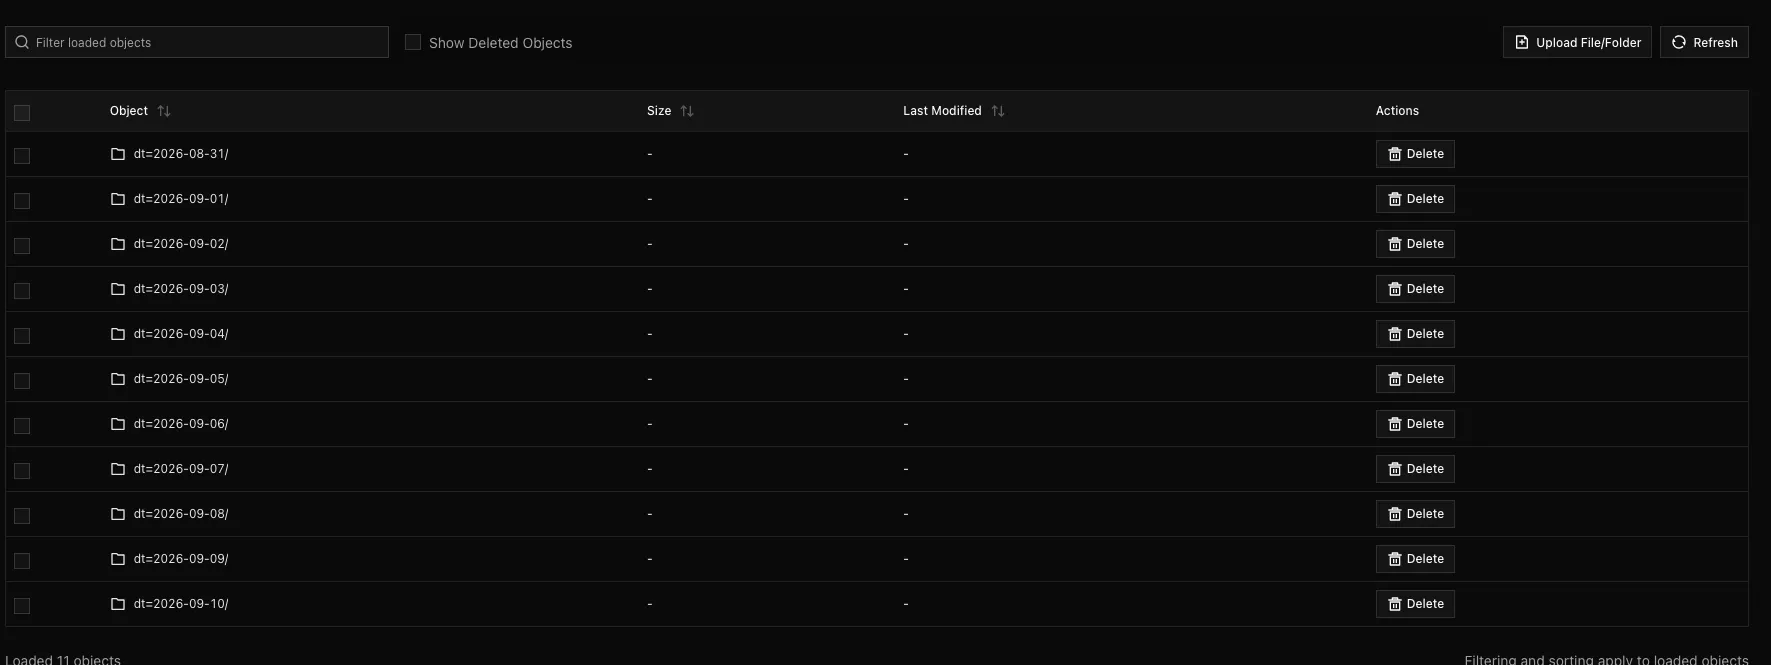
A query for dt = '2026-09-01' AND hr = '14' reads Manifest A only. Manifest B is skipped before any Parquet is opened. This is partition pruning.
Alternatives to Nessie
| Catalog | Trade-off |
|---|---|
| AWS Glue | Managed, no ops, AWS-locked |
| Hive Metastore | Mature, heavy, HDFS familiarity needed |
| Polaris (Apache) | Vendor-neutral REST catalog, newer |
| SQLite REST | Lightweight, single-node, not HA |
Nessie fits here because PostgreSQL is already in the stack one less moving part. The cloud options make sense if you’re already on AWS or GCP. DuckDB is on the list to try properly on Parquet queries; the numbers it produces are worth a direct look.
Trino: querying the archive#
Trino connects to Nessie via the Iceberg REST catalog and reads Parquet from RustFS directly:
# trino/etc/catalog/o11y_logs.properties
connector.name=iceberg
iceberg.catalog.type=rest
iceberg.rest-catalog.uri=http://nessie:19120/iceberg

fs.s3.enabled=true
s3.endpoint=http://10.0.5.191:7000
s3.path-style-access=true
CloudBeaver provides the browser SQL interface, pre-configured with a JDBC connection to o11y_logs/logs.
DuckDB for ad-hoc checks
DuckDB reads Parquet directly from S3 with no catalog and no cluster:
INSTALL httpfs; LOAD httpfs;
SET s3_endpoint = '10.0.5.191:7000';
SET s3_use_ssl = false;

SELECT service_name, count(*) AS rows
FROM read_parquet(
  's3://o11y-archive/iceberg/logs/o11y_logs/data/dt=2026-09-01/hr=14/*.parquet'
)
GROUP BY service_name ORDER BY rows DESC;| Trino | DuckDB | |
|---|---|---|
| Iceberg-aware | Yes (via Nessie) | Partial (reads Parquet, not full catalog) |
| Partition pruning | Full | Manual path in query |
| Shared team access | Yes | No |
| Best for | Team queries, Grafana, scheduled jobs | Local exploration, quick checks |
When to choose this vs simpler alternatives#
| Iceberg + Trino | Loki on S3 | ClickHouse + S3 tiering | |
|---|---|---|---|
| Compression | 15-40x (Parquet ZSTD) | 8-15x (chunk gzip) | 14-33x (MergeTree) |
| Query language | Full SQL | LogQL | Full SQL |
| Column projection | Yes | No, full chunk scan | Yes |
| Partition pruning | Yes (dt/hr) | No | Yes |
| Open format | Yes, any engine reads it | No | No |
| Extra infra if Flink running | Low | Medium | Medium |
| Extra infra from scratch | High (5 components) | Low | Medium |
If you’re not running Flink: ClickHouse with S3 tiering gives SQL on cold logs with one additional component. Simpler, comparable compression. That path is covered next.
If Flink is already running: adding the Iceberg archival job costs almost nothing. Parquet + Iceberg is engine-agnostic. DuckDB, PyIceberg, Spark, and Athena can all read it if Trino goes away.
How Loki and Iceberg differ when fetching from cold storage#
Both store log data in S3. The read path is fundamentally different.
Loki writes log chunks to S3, indexed only by label set and time range. A query like {service="traefik"} |= "error" over 30 days fetches every chunk that overlaps the time range and label set: entire chunks, byte for byte, then filters inside them. There is no column projection. If your chunk is 8 MiB and you need three fields from it, you read 8 MiB.
Iceberg with Trino works the opposite way. Partition pruning skips all Parquet files outside dt and hr predicates before any file is opened. Column projection means only service_name, log_level, and event_time are read from disk. raw_json and log, which hold most of the bytes, are skipped entirely.
For operational tailing last 15 minutes, one service Loki is faster and has one-tenth the setup. For analytical queries across weeks, the column-oriented read path is not a marginal win.
Measured on this homelab, the error rate query across 8 days (20M rows):
Trino (Iceberg, column projection)  →  365 MB  physical I/O from RustFS   ~1 min
Loki  (S3 chunks, full read)        →  ~34 GB  physical I/O from RustFS   estimate
                                                 ~90x more I/O
Both are RustFS reads bytes transferred from the same S3-compatible object store over the network. The 365 MB is not a cache hit.
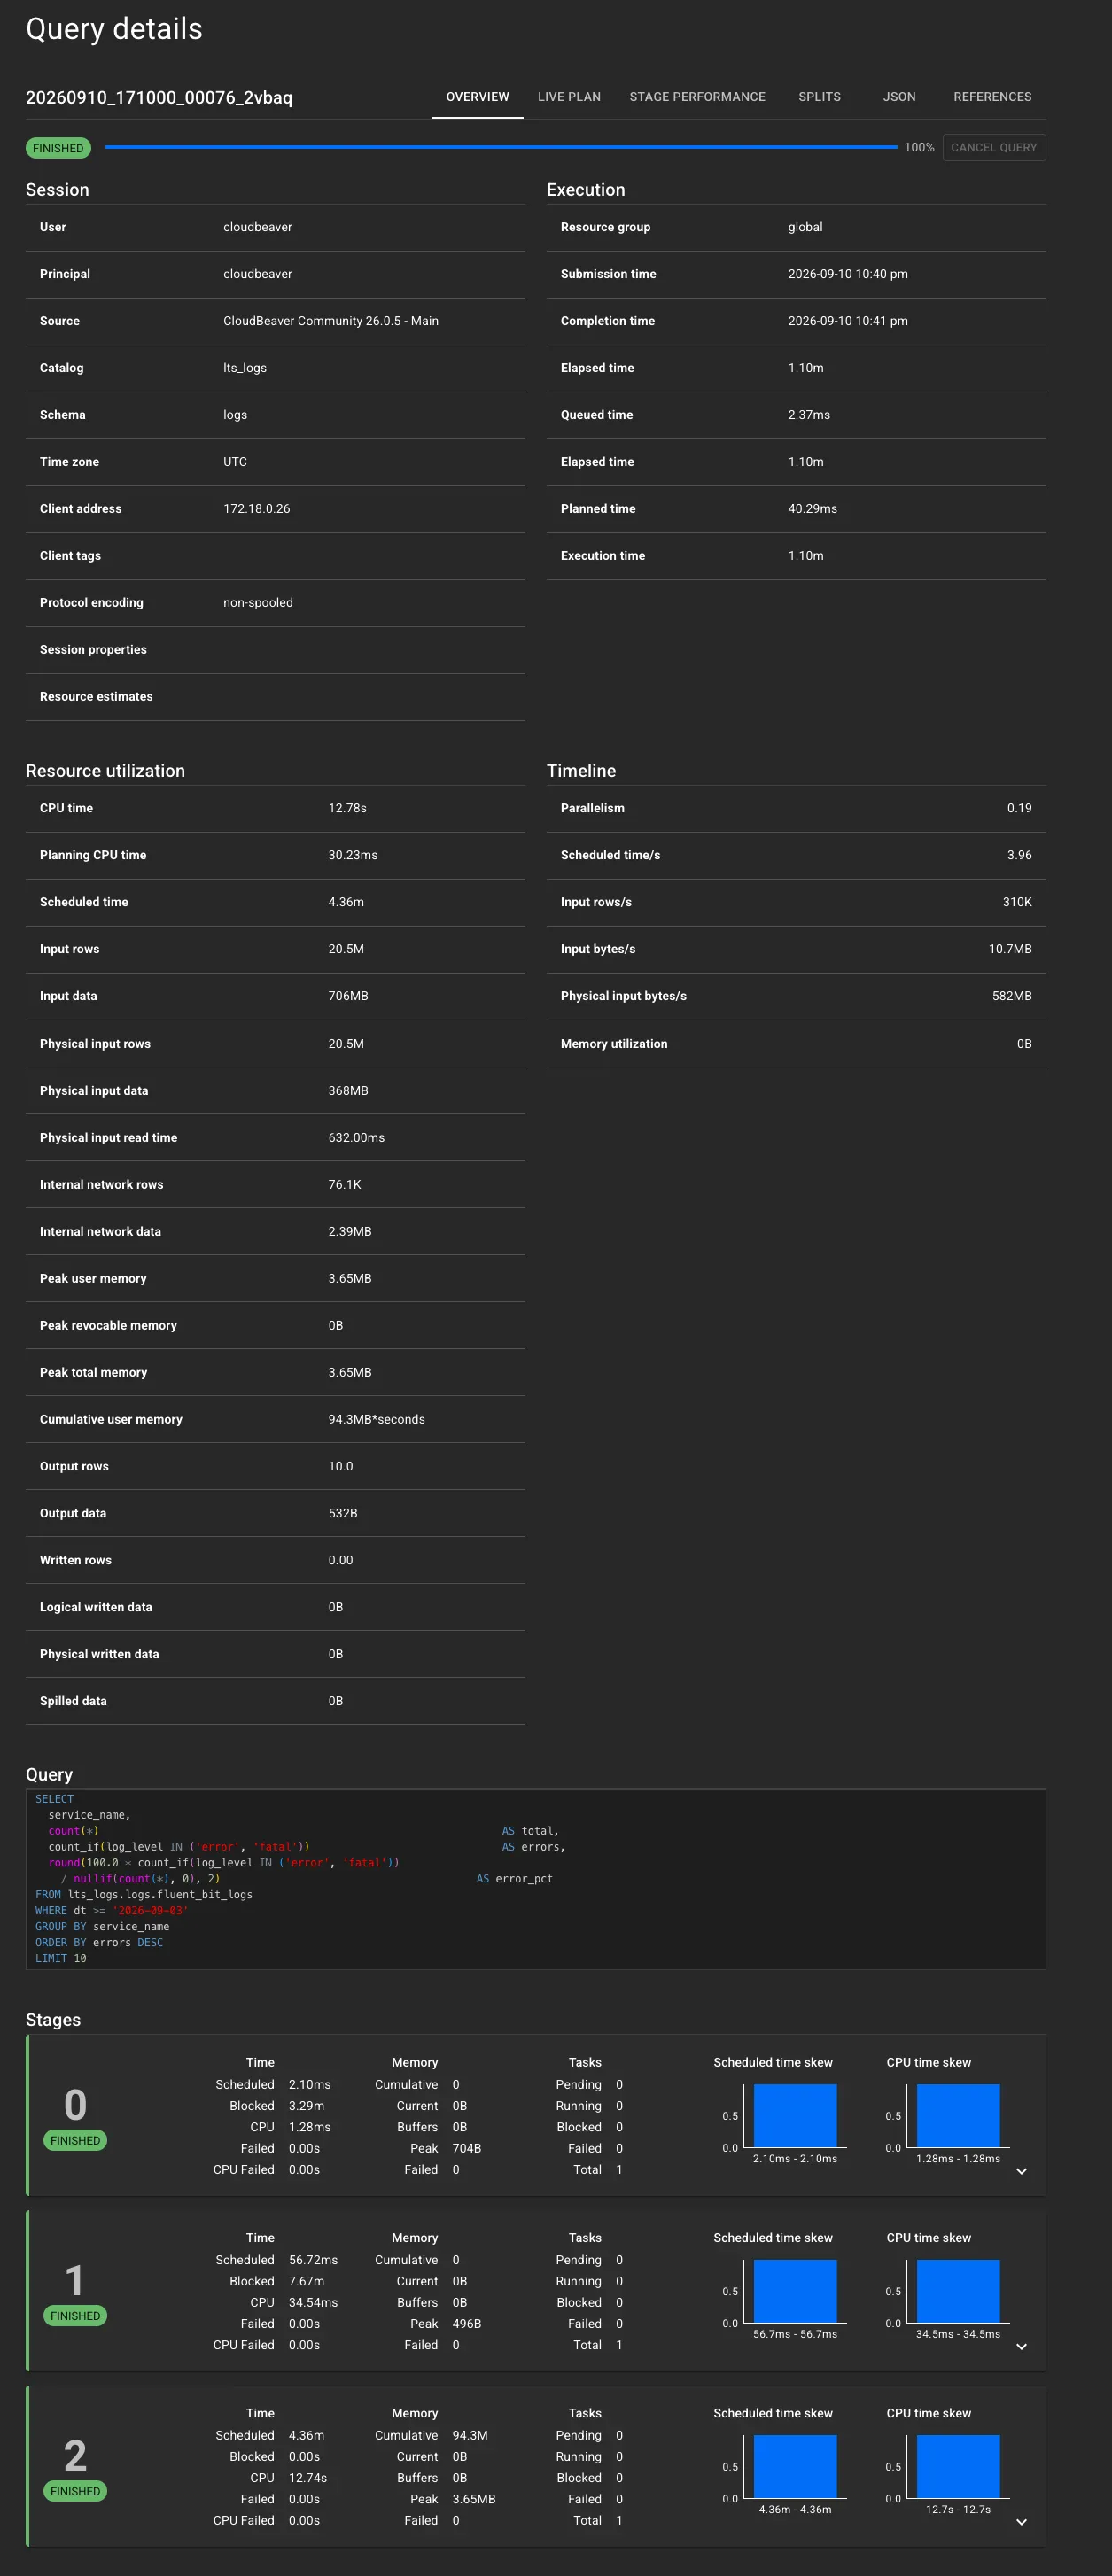
Parquet stores each column as a separate byte range within the file. Trino issues range requests to RustFS for only the service_name, log_level, and dt byte ranges. log and raw_json are never transferred. Loki chunks are opaque compressed blobs. There is no way to request one field from a chunk. The full object downloads, decompresses, then filters. Loki 3.x bloom filters reduce which chunks are fetched, not how much of each fetched chunk is read.
Scale projections from real numbers#
This homelab ingests ~34 GiB/day raw into Kafka, storing ~1 GiB/day as Parquet ZSTD. That is 33x compression on OTLP-heavy structured log data. Typical application logs compress less (5-15x), so the storage numbers below use a conservative 20x.
Loki stores the same data differently: gzip-compressed chunks, not columnar. The same 30 days that Parquet fits into ~30 GiB would take ~128 GiB in Loki on RustFS (~8x gzip on raw). That gap is why the query I/O numbers diverge. Trino reads a fraction of what is stored; Loki reads most of it.
| Homelab (actual) | 100 GiB/day | 500 GiB/day | |
|---|---|---|---|
| Raw into Kafka | ~34 GiB/day | 100 GiB/day | 500 GiB/day |
| Parquet stored (Trino path) | ~1 GiB/day | ~5 GiB/day | ~25 GiB/day |
| Chunk stored (Loki path) | ~4 GiB/day | ~13 GiB/day | ~63 GiB/day |
| 30-day Parquet archive | ~30 GiB | ~150 GiB | ~750 GiB |
| 30-day Loki archive | ~128 GiB | ~375 GiB | ~1.9 TiB |
| Trino 30d error query I/O | ~1.4 GB | ~7 GB | ~34 GB |
| Loki 30d error query I/O | ~128 GB | ~375 GB | ~1.9 TB |
| Query I/O ratio | ~90x | ~54x | ~56x |
| Flink parallelism | 2 slots | 4-6 slots | 12-16 slots |
| Trino workers | 1 | 1 | 2-3 |
At 100 GiB/day: the stack handles it without structural changes. Kafka, Nessie on PostgreSQL, and a single Trino worker are all fine. The one thing that breaks is the file size target. Each 3-minute checkpoint processes ~208 MiB raw, compressed to ~10 MiB of Parquet well under the 128 MiB target. After 30 days you have ~14,400 small files. Compaction goes from optional to mandatory, or increase the checkpoint interval to 15-20 minutes to let files accumulate to target size before closing.
At 500 GiB/day: Flink needs more parallelism (12-16 slots across multiple TaskManagers), and a single Trino worker starts to show on the larger scans. The 9 TiB/year footprint needs real capacity planning on RustFS. Everything else Nessie, Kafka, the partition layout scales horizontally without redesign.
What you can build on top of log history#
Check what’s in the archive#
-- Reads metadata only, never opens Parquet files
SELECT
    count(*)                                                     AS parquet_files,
    sum(record_count)                                            AS total_rows,
    round(sum(file_size_in_bytes) / power(1024, 3), 3)          AS stored_gib,
    round(sum(file_size_in_bytes) / sum(record_count), 2)        AS bytes_per_row
FROM o11y_logs.logs."o11y_logs$files"
WHERE content = 0;
Running this on the homelab (32 days archived, Aug 9 to Sep 10):
| parquet_files | total_rows | stored_gib | bytes_per_row |
|---|---|---|---|
| 13,290 | 76,246,650 | 57.716 | 812 |
76M rows, 57.7 GiB on disk. ~33x compression on structured log data.
30-day error rate per service#
SELECT
    dt,
    service_name,
    count(*)                                                               AS total,
    count_if(log_level IN ('error', 'fatal'))                              AS errors,
    round(100.0 * count_if(log_level IN ('error', 'fatal'))
          / nullif(count(*), 0), 2)                                        AS error_pct
FROM o11y_logs.logs.o11y_logs
WHERE dt >= date_format(current_date - INTERVAL '30' DAY, '%Y-%m-%d')
GROUP BY dt, service_name
ORDER BY dt DESC, errors DESC;
Run this weekly. A service whose error_pct doubles over two weeks is worth investigating before it becomes an incident.
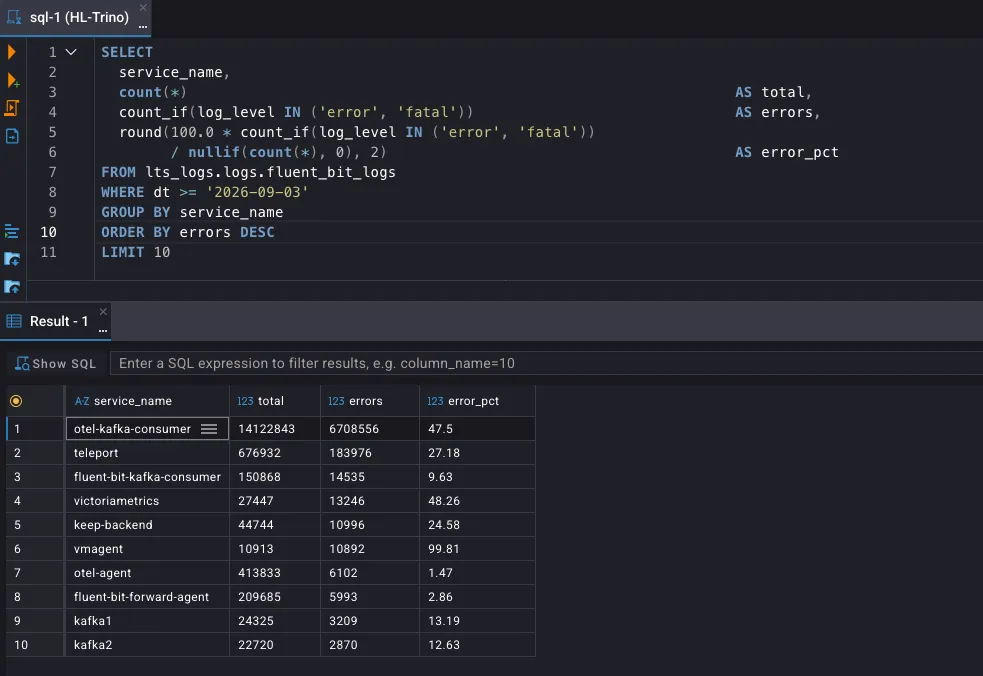
vmagent at 98.9% and otel-kafka-consumer at 48.6% were outside the configured 7-day retention window. You could extend VictoriaLogs retention to cover this, but that means keeping weeks of data on local NVMe rather than cheap object storage. The Iceberg path exists precisely to avoid that trade-off: hot search stays fast and inexpensive on VictoriaLogs, historical analysis lands on S3 at a fraction of the cost.
Top noisy services#
Who is filling your Kafka topic, Iceberg partition, and S3 bucket:
SELECT
    service_namespace,
    service_name,
    count(*)                                                     AS rows,
    round(sum(length(coalesce(log, ''))) / power(1024, 2), 2)   AS raw_log_mib,
    count_if(log_level IN ('error', 'fatal'))                    AS errors
FROM o11y_logs.logs.o11y_logs
WHERE dt >= date_format(current_date - INTERVAL '30' DAY, '%Y-%m-%d')
GROUP BY service_namespace, service_name
ORDER BY rows DESC
LIMIT 20;
Running this on the homelab (last 8 days, Sep 2-10):
| namespace | service_name | rows | raw_log_mib | errors |
|---|---|---|---|---|
| observability | otel-kafka-consumer | 14,769,552 | 229,942 | 7,044,411 |
| proxy | traefik-ext-socket-proxy | 1,116,585 | 197 | 2 |
| media | socket-proxy | 816,292 | 142 | 0 |
| default | teleport | 809,912 | 84 | 221,781 |
| proxy | traefik | 679,453 | 0 | 39 |
| default | otel-agent | 425,323 | 32 | 5,885 |
| default | tail-log | 339,082 | 792 | 0 |
| data-platform | flink-taskmanager | 196,301 | 79 | 2,777 |
otel-kafka-consumer alone accounts for 14.7M rows. One service, one observability pipeline, generating the majority of the log volume. That’s the kind of signal you only see when you can query the full history.
Silence detection#
Services that logged last week but not this week. Going silent is often an infra problem, not a quiet period:
WITH last_week AS (
    SELECT DISTINCT service_name FROM o11y_logs.logs.o11y_logs
    WHERE dt BETWEEN
        date_format(current_date - INTERVAL '14' DAY, '%Y-%m-%d')
        AND date_format(current_date - INTERVAL '7' DAY, '%Y-%m-%d')
),
this_week AS (
    SELECT DISTINCT service_name FROM o11y_logs.logs.o11y_logs
    WHERE dt >= date_format(current_date - INTERVAL '7' DAY, '%Y-%m-%d')
)
SELECT lw.service_name
FROM last_week lw
LEFT JOIN this_week tw ON lw.service_name = tw.service_name
WHERE tw.service_name IS NULL
ORDER BY lw.service_name;
Running this on the homelab (Sep 2-6 vs Sep 7-10):
| service_name |
|---|
| glance |
| rustfs |
| traefik-log-dashboard-agent |
rustfs stopped logging. That’s the object store backing the Iceberg archive. Worth checking immediately. glance and traefik-log-dashboard-agent are likely stopped containers, but rustfs going silent on a storage node is the kind of signal you’d miss entirely if your logs expired before you looked.
Error type breakdown#
Error rates tell you something is wrong. Error types tell you what kind of wrong: connection refused is infrastructure, a 5xx is application code, a timeout is latency. They point to different owners and different fixes.
SELECT
    service_name,
    count(*)                                              AS total_errors,
    count_if(
        lower(log) LIKE '%connection refused%'
        OR lower(log) LIKE '%connection reset%'
    )                                                     AS conn_refused,
    count_if(
        lower(log) LIKE '%timeout%'
        OR lower(log) LIKE '%timed out%'
    )                                                     AS timeouts,
    count_if(regexp_like(log, ' 5[0-9]{2}[ "/]'))        AS http_5xx,
    count_if(regexp_like(log, ' 4[0-9]{2}[ "/]'))        AS http_4xx
FROM o11y_logs.logs.o11y_logs
WHERE dt >= date_format(current_date - INTERVAL '7' DAY, '%Y-%m-%d')
  AND log_level IN ('error', 'fatal')
GROUP BY service_name
HAVING count(*) > 50
ORDER BY total_errors DESC;
Running on the homelab (Sep 3-10):
| service_name | total_errors | conn_refused | timeouts | http_5xx | http_4xx |
|---|---|---|---|---|---|
| teleport | 183,867 | 7,764 | 0 | 0 | 0 |
| fluent-bit-kafka-consumer | 14,535 | 12,882 | 8 | 0 | 0 |
| victoriametrics | 12,013 | 2,251 | 0 | 0 | 0 |
| keep-backend | 9,874 | 0 | 0 | 0 | 0 |
| vmagent | 9,769 | 7 | 0 | 0 | 0 |
| dockhand | 1,294 | 818 | 109 | 0 | 0 |
| netbird | 1,032 | 2 | 318 | 318 | 0 |
HTTP 4xx/5xx are almost absent. The dominant failure mode is infrastructure-level: connection refused and service-specific log noise. fluent-bit-kafka-consumer is the most telling: 12.8K of its 14.5K errors are connection errors. That’s the log forwarder itself struggling to reach Kafka, surfaced only because the archive covers 7 days of its own error history.
Recurring error fingerprint#
A transient failure produces varied messages and fades out. A misconfiguration produces the same message, every day, indefinitely. This query separates the two:
SELECT
    service_name,
    substr(log, 1, 80)      AS error_fingerprint,
    count(DISTINCT dt)      AS days_seen,
    count(*)                AS total
FROM o11y_logs.logs.o11y_logs
WHERE dt >= date_format(current_date - INTERVAL '14' DAY, '%Y-%m-%d')
  AND log_level IN ('error', 'fatal')
GROUP BY service_name, substr(log, 1, 80)
HAVING count(DISTINCT dt) >= 5
ORDER BY days_seen DESC, total DESC
LIMIT 15;
Running on the homelab:
| service_name | error_fingerprint | days_seen | total |
|---|---|---|---|
| traefik | Router jackett cannot be linked to multiple Services | 8 | 1,092 |
| dockhand | [MetricsSubprocess] Failed to collect metrics for hl-observability | 7 | 142 |
| dockhand | [EventSubprocess] Connection error for hl-observability | 7 | 88 |
traefik has logged the same routing conflict every day for 8 days. Jackett is mapped to multiple backends and Traefik cannot decide which one to use. 1,092 errors, zero new information after day one. Without the fingerprint query this reads as ongoing error traffic on the rate chart. With it, it’s a one-line config fix that’s been sitting there for over a week.