Designing a Scalable & Fault-Tolerant Log Pipeline [Part 3]: Storage & Analytics
Hot and cold storage are two separate decisions. VictoriaLogs, Loki, ClickHouse, and Iceberg/Parquet compared internals, benchmarks, and what I'm running.
This is Part 3 of a series on building a scalable, fault-tolerant log pipeline. Part 1 covered agents and forwarders. Part 2 covered the buffer layer. This part covers where the data lands: storage and analytics.
Agents → Forwarders → Kafka → Storage & AnalyticsThis is the layer where the previous decisions land. Everything the agent collected, the forwarder enriched, and Kafka buffered has to go somewhere and the storage choice determines whether you can actually query it six months from now without spinning up a cluster or waiting long for a result.
Most teams pick one system and discover the trade-off later. This post is about deliberately making that split.
Layer 3: Storage & Analytics#
Two decisions, not one#
Hot storage — VictoriaLogs / Loki / Elasticsearch Fast search on recent logs. Operational use. “What’s failing right now?”
Cold storage — ClickHouse / Iceberg + Parquet / Loki on S3 Analytics on historical logs. “What was the error rate for this service last quarter?”
Treat them as one decision and you land in one of two traps: either you overspend keeping months of data hot and instantly queryable, or you archive cheaply and discover you can’t actually query it when you need to. The access patterns differ, the cost profiles differ, and the engines built for one are rarely good at the other.
Split the decision, and the architecture gets simpler, not more complex.
Hot Storage: VictoriaLogs vs Loki vs Elasticsearch#
Query language#
| System | Query language | Designed for |
|---|---|---|
| VictoriaLogs | LogsQL | Stream filtering, full-text, operational tailing |
| Loki | LogQL | Label-based filtering, close to PromQL |
| Elasticsearch | Lucene / EQL | Full inverted index, aggregations, full-text |
If you’re already on Grafana, LogQL feels natural, it shares the mental model with PromQL. If full-text search across structured and unstructured data is the primary need, Elasticsearch is built for it. LogQL is the fastest for the operational workload: filter by service, filter by level, tail recent logs.
Cardinality: where Loki bites#
In Loki, labels serve two purposes at once: they define stream identity and act as the query index. That dual role means any field you want to filter on must become a label, and high-cardinality values trace IDs, user IDs, IP addresses cause the index to explode.
VictoriaLogs separates the two concerns. Stream fields (host, app, pod) define identity and stay low-cardinality. All other fields are stored as compressed columns with per-block bloom filters, making any JSON field queryable at query time without declaring it upfront or reindexing.
The caveat is worth stating clearly: VictoriaLogs does not remove the cardinality problem, it moves it. Placing a high-cardinality value into a stream field causes the same explosion. Their documentation explicitly warns against using ip, user_id, or trace_id as stream fields. The practical difference is that in Loki the trap is on the default path, while in VictoriaLogs it is an opt-in mistake you can monitor via vl_streams_created_total.
               ┌──────────────────────────────────────┐
               │          INCOMING LOG ENTRY          │
               │                                      │
               │  host, app            →  low-card    │
               │  trace_id, user_id, ip → HIGH-card   │
               └──────────────────────────────────────┘
                                   │
                  ┌────────────────┴────────────────┐
                  │                                 │
     ╔═════════════════════════╗       ╔═════════════════════════╗
     ║           LOKI          ║       ║       VICTORIALOGS      ║
     ╚═════════════════════════╝       ╚═════════════════════════╝
                  ▼                                 │
     ┌─────────────────────────┐         ┌──────────┴───────┐
     │ labels = stream identity│         │                  │
     │   AND the query index   │  ┌──────────────┐   ┌──────────────┐
     └─────────────────────────┘  │    STREAM    │   │   REGULAR    │
                  ▼               │    fields    │   │    fields    │
     ┌─────────────────────────┐  │              │   │              │
     │  to filter trace_id, it │  │  host, app   │   │ trace_id, ip │
     │   MUST become a label   │  │  → stream    │   │   user_id    │
     └─────────────────────────┘  │   identity   │   │ → columnar   │
                  ▼               │  (low-card)  │   │ + bloom idx  │
     ┌─────────────────────────┐  └──────────────┘   └──────────────┘
     │   each unique value =   │         │                  │
     │    a brand-new stream   │         └────────┬─────────┘
     └─────────────────────────┘                  ▼
                  ▼               ┌────────────────────────────────┐
     ╔═════════════════════════╗  │    high-card = just columns    │
     ║      INDEX EXPLODES     ║  │    any JSON field queryable    │
     ║    cardinality blowup   ║  │   at query time, no reindex    │
     ║   on the DEFAULT path   ║  └────────────────────────────────┘
     ╚═════════════════════════╝                  ▼
                                  ┌╌╌╌╌╌╌╌╌╌╌╌╌╌╌╌╌╌╌╌╌╌╌╌╌╌╌╌╌╌╌╌╌┐
                                  ╎             CAVEAT              ╎
                                  ╎ put a high-card field in STREAM ╎
                                  ╎   fields → SAME explosion.      ╎
                                  ╎ watch vl_streams_created_total  ╎
└╌╌╌╌╌╌╌╌╌╌╌╌╌╌╌╌╌╌╌╌╌╌╌╌╌╌╌╌╌╌╌╌┘In a January 2026 benchmark by Basekick (the team building Arc), Loki silently dropped roughly 98% of the logs sent to it — only 1.36 million of 50 million made it to storage, while the API returned HTTP 204 success responses the entire time. The cause is architectural: out-of-order rejection and per-stream rate limits.
Ingestion throughput#
Same benchmark, 60-second sustained run, default configs, WAL enabled:
| System | Logs/second | vs VictoriaLogs |
|---|---|---|
| VictoriaLogs | ~2.26M | baseline |
| Loki | ~1.14M | 2x slower |
| ClickHouse | ~401K | 5.6x slower |
| Elasticsearch | ~101K | 22x slower |
The ClickHouse and Elasticsearch numbers matter beyond the throughput headline. Both degraded over the run, ClickHouse from background merge operations, Elasticsearch from segment management overhead. That write-amplification tax is structural, not a tuning problem.
Query latency: the honest, mixed picture#
VictoriaLogs is fast on most operational query types but not universally the winner:
| Query type | VictoriaLogs | Elasticsearch | Quickwit |
|---|---|---|---|
| Full-text filter | Fast | Fast | Fast |
| Time range scan | Fast | Slow | Fast |
| Top-10 aggregation | ~158ms | ~1.1ms | ~0.81ms |
| Bulk retrieval | Fast | Slow | — |
Elasticsearch’s inverted index is excellent at aggregations and term lookups for that Top-10 query it’s 140x faster. VictoriaLogs wins for the hot-tier workload: filter by service, tail logs, full-text search. It loses when you ask it to behave like an analytics engine.
Which is the whole argument for a separate cold tier.
S3 support: the pivotal architectural constraint#
| System | Object storage |
|---|---|
| Loki | Native S3 / GCS / Azure support for chunk storage |
| Elasticsearch | S3 snapshots, searchable snapshots for cold tier |
| VictoriaLogs | On roadmap not production-ready yet |
This is the constraint that shaped my architecture. VictoriaLogs historically had no object storage support, local disk only. That is now changing: the tracking issue is VictoriaLogs #48, an initial PR has merged, and it is listed on the official roadmap. But the current implementation still depends on local storage for normal operation. Follow-up issues #1332 and #1341, both opened in April 2026, are still open.
As of now, you cannot run a fully S3-backed VictoriaLogs setup. Anything beyond the local retention window is gone unless you build a separate archival pipeline.
Schema flexibility#
| System | Schema approach |
|---|---|
| VictoriaLogs | Schema-free: any JSON field queryable at query time |
| Loki | Label-based streams: new fields need parsing rules upfront |
| Elasticsearch | Typed mapping: schema changes require reindexing |
This matters for the cold path strategy. The raw_json column approach, storing the complete original Kafka message and extracting fields at query time only works if the hot tier can handle arbitrary JSON natively. VictoriaLogs does. Loki requires a parser defined before ingestion, which means any field you didn’t plan for is effectively lost.
Cold Storage#
ClickHouse + S3 tiering#
Hot data on local disk, older partitions automatically offloaded to S3, SQL across both tiers. The word “automatic” hides a mechanism worth understanding.
ClickHouse’s MergeTree engine handles tiered storage through storage policies. You define volumes hot, warm, cold each backed by one or more disks, and data moves between them on two triggers:
Space-based: Each volume has a move_factor (default 0.1). When free space on the hot volume drops below that ratio, ClickHouse moves the oldest parts to the next volume.
Time-based: TTL expressions move parts on age regardless of pressure.
<!-- config.xml: storage policy -->
<storage_configuration>
  <disks>
    <hot>
      <path>/mnt/nvme/clickhouse/</path>
    </hot>
    <s3>
      <type>s3</type>
      <endpoint>https://o11y-logs-cold.s3.amazonaws.com/clickhouse/</endpoint>
      <use_environment_credentials>true</use_environment_credentials>
    </s3>
  </disks>
  <policies>
    <tiered>
      <volumes>
        <hot>
          <disk>hot</disk>
          <max_data_part_size_bytes>1073741824</max_data_part_size_bytes>
        </hot>
        <cold>
          <disk>s3</disk>
        </cold>
      </volumes>
      <move_factor>0.1</move_factor>
    </tiered>
  </policies>
</storage_configuration>
-- Table with tiering and TTL
CREATE TABLE logs (
timestamp DateTime,
service LowCardinality(String),
level LowCardinality(String),
message String
)
ENGINE = MergeTree()
PARTITION BY toDate(timestamp)
ORDER BY (service, timestamp)
TTL timestamp + INTERVAL 30 DAY TO VOLUME 'cold'
SETTINGS storage_policy = 'tiered';The move happens in the background, transparent to queries. The trade-off is the write amplification you saw in the ingestion numbers. MergeTree writes many small parts and continuously merges them those background merges rewrite data and add I/O overhead that grows with ingestion rate. At heavy sustained ingest, tune with async inserts and larger batches, or it becomes a problem.
ClickHouse’s own measurements on ~100GB/day of real Kubernetes logs:
| Agent | Compression ratio |
|---|---|
| Fluent Bit | 33.04x |
| Vector | 21.13x |
| OTEL Collector | 14.1x |
These excluded sparse Kubernetes annotations, which compress at 100x+ and would inflate the numbers. Further tuning of non-optimised schemas can improve them.
Iceberg / Parquet on S3#
Flink archives continuously from Kafka to Iceberg tables on RustFS. Trino handles SQL queries against the archive. More components to manage, but the architecture earns it:
- ZSTD on columnar Parquet compresses structured log data hard
- Partition pruning on
(dt, hr)keeps historical queries fast, a query for one hour reads zero files from other partitions - The
raw_jsoncolumn preserves every original Kafka field for extraction at query time - Iceberg v2 gives atomic commits, schema evolution, and time travel, no partial writes visible to readers
Columnar Parquet with ZSTD compression lands in the same range as the ClickHouse numbers above: 15-40x on well-structured log data. The actual ratio depends on your schema. Low-cardinality fields like service_name, log_level, and host_name compress aggressively when dictionary-encoded and pull the ratio up. Free-text message fields compress at roughly what any general-purpose compressor would give you. A vendor quoting a flat 40x without qualification is measuring the easy case.
What querying historical data actually looks like:
-- Error rate per service over the last 3 days
-- Runs against months of Parquet files, partition-pruned by dt
SELECT
  dt,
  service_name,
  count(*) AS total,
  count_if(log_level IN ('error', 'fatal')) AS errors,
  round(100.0 * count_if(log_level IN ('error', 'fatal')) / count(*), 2) AS error_pct
FROM lts_logs.logs.fluent_bit_logs
WHERE dt >= date_format(current_date - INTERVAL '3' DAY, '%Y-%m-%d')
GROUP BY dt, service_name
ORDER BY dt DESC, errors DESC;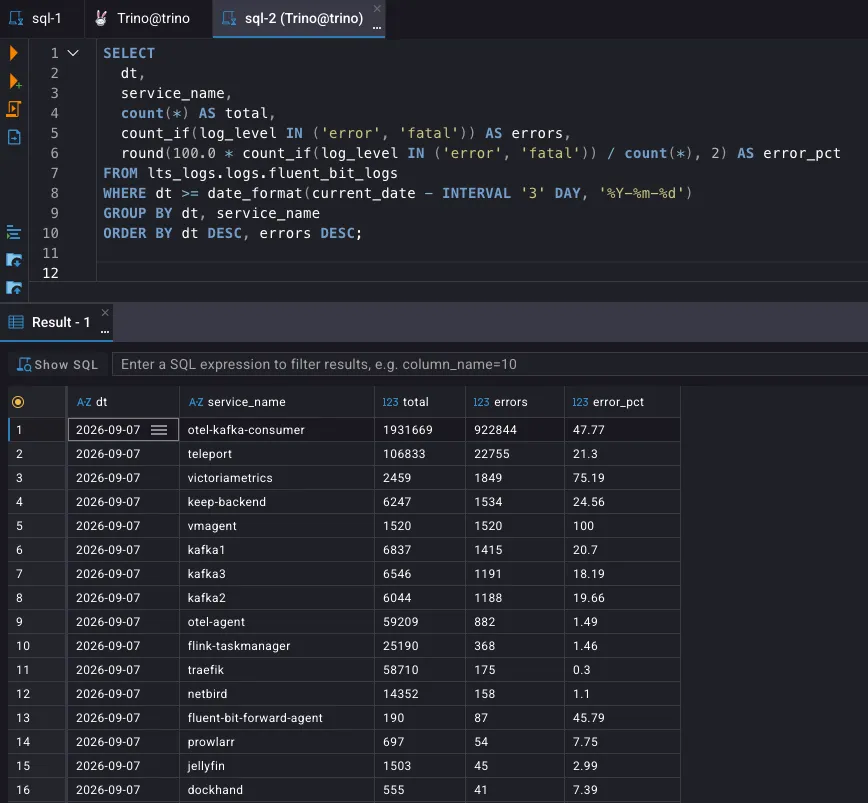
VictoriaLogs cannot run this query. It stores data on local disk and expires it after your configured retention period. Once that window passes, the data is gone. Loki on S3 can run it, but without columnar pushdown it scans every chunk. Trino on Iceberg prunes to the exact partitions and reads only the columns needed.
Loki chunks on S3#
Loki natively stores compressed chunks on S3, and it works. For pure retention, it’s the cheapest option, no extra infrastructure, no separate archival pipeline.
But querying old data is slow. No columnar format, no partition pruning, no predicate pushdown. The entire relevant chunk has to be fetched and decompressed before filtering. You can store it cheaply; running analytics against it is painful.
Fine as a cheap archive. Wrong as an analytical store.
How retention actually works#
| System | How deletion happens | Lag after expiry |
|---|---|---|
| VictoriaLogs | Daily partition (20260901) deleted once outside retention window. Disk cap evicts oldest partition first, regardless of age. Minimum 2 days always retained. (docs) | Near-instant |
| Loki | Compactor marks chunks every ~15 min. Async sweeper removes them after -compactor.retention-delete-delay (default 2 hours). (docs) | ~2 hours |
| Elasticsearch | ILM polls every 10 min (indices.lifecycle.poll_interval). Index deleted on next cycle after threshold is met. (docs) | ≤10 minutes |
| ClickHouse | TTL enforced at background merge. merge_with_ttl_timeout defaults to 4 hours. Force with OPTIMIZE TABLE ... FINAL. (docs) | ≤4 hours |
| Iceberg / Parquet | No automatic expiry. Data stays until you run expire_snapshots. | You own it |
Example: 15-day retention, 100 GB/day raw, data starts Sept 1
| System | Sept 1 deleted on |
|---|---|
| VictoriaLogs | Sept 16 (or earlier if disk cap triggers first) |
| Loki | Sept 16 + ~2 hours |
| Elasticsearch | Sept 16 within 10 minutes |
| ClickHouse | Sept 16 within 4 hours |
| Iceberg / Parquet | Whenever you run the cleanup job |
Disk sizing for the same scenario
| System | Compression | Stored/day | 15-day disk needed |
|---|---|---|---|
| VictoriaLogs | 15-30x | ~4-7 GB | ~75-130 GB local. Set disk cap = daily x 15 x 1.2 to avoid early eviction. |
| Loki | 10-20x | ~5-10 GB | ~75-150 GB on S3. Local index is negligible. |
| Elasticsearch (standard) | ~1.4x | ~71 GB | ~1.6 TB local. Inverted index, doc values, and BKD trees write the same data four times. |
| Elasticsearch (LogsDB) | ~5-6x | ~17 GB | ~380 GB local. 8.16+ feature columnar storage for log fields, 50-75% smaller. |
| ClickHouse (hot) | 15-33x | ~3-7 GB | ~90-210 GB NVMe. Size at 2x steady-state, MergeTree holds old and new part during merge. |
Elasticsearch’s standard mode is the one that catches teams off guard. A 73% index-to-raw ratio (source) means you are storing nearly as much as you ingested, before accounting for segment overhead. LogsDB closes that gap significantly. ClickHouse requires 2x NVMe headroom for merge operations budget for it upfront or you will hit disk pressure mid-month.
That last one is a genuine operational gotcha. Iceberg gives you full control and removes the safety net. Forget the cleanup job and your cold storage grows indefinitely snapshots accumulate, orphaned files pile up, and the metadata layer slows down. Add a scheduled maintenance job before you go to production:
-- Expire snapshots older than 7 days (run on schedule)
ALTER TABLE lts_logs.logs.fluent_bit_logs
EXECUTE expire_snapshots(older_than => now() - INTERVAL '7' DAY);

-- Remove orphaned files
ALTER TABLE lts_logs.logs.fluent_bit_logs
EXECUTE remove_orphan_files(older_than => now() - INTERVAL '3' DAY);Parts 1 through 3 have covered the full pipeline: collection at the edge, buffering through Kafka, and storage split between hot search and cold analytics. The architecture works end to end. What is left is the processing layer the Flink jobs that sit between the buffer and storage, running correlation across signals in real time. That is Part 4.