Correlating Telemetry in Grafana: From Metrics to Logs to Traces
How to navigate from a firing alert to a root cause using Grafana, Tempo, Loki, OpenSearch, and Prometheus
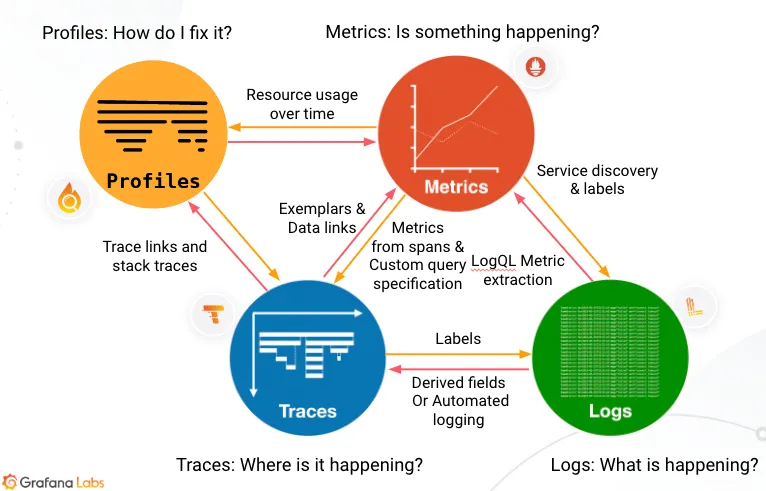
Modern observability generates distinct signals from every request: metrics show aggregate health, traces show request paths, and logs explain individual events. The problem is not collecting them; it is connecting them during an incident without switching between tools and manually reconstructing context.
Grafana telemetry correlation creates direct navigation links between data sources. A metric spike opens the matching trace. A trace span opens its logs. A log line navigates back to the trace. Every link carries the shared context — trace ID, service name, time range — automatically.
This post walks through a complete, real incident investigation on the OpenTelemetry Astronomy Shop demo.
What is telemetry correlation?#
Each signal answers a different question:
- A metric shows that something is wrong
- A trace shows where it went wrong
- A log explains why it went wrong
- A profile shows which code consumed the resources
Correlation connects them using shared context: trace ID, span ID, service name, and time range. Without it, engineers copy trace IDs between browser tabs and reconstruct the timeline manually. With it, each signal links directly to the next.
Stack#
                          ┌─────────────────┐
                          │     Grafana      │
                          └────────┬─────────┘
                                   │
      ┌────────────────────────────┼─────────────────────────┐
      │                            │                          │
┌──────▼──────┐   ┌────────────────▼──────────────┐   ┌──────▼──────┐
│ Prometheus  │   │  OpenSearch  │  Loki           │   │    Tempo    │
│  (metrics)  │   │ (svc logs)   │  (browser logs) │   │  (traces)   │
└─────────────┘   └──────────────┴─────────────────┘   └─────────────┘
      ▲                    ▲              ▲                   ▲
      │                    │              │                   │
OTel Collector       OTel Collector   Grafana Alloy    OTel Collector
OTLP → Prometheus    OTLP → OpenSearch Faro receiver   OTLP → Tempo
Backend service logs (payment, checkout, cart) flow through the OTel Collector to OpenSearch. Browser logs from the Grafana Faro SDK go through Grafana Alloy to Loki. Traces go to Tempo. Metrics go to Prometheus.
The incident#
Triggering the failure#
Navigate to the Flagd feature flag UI. Set paymentFailure to 90%.
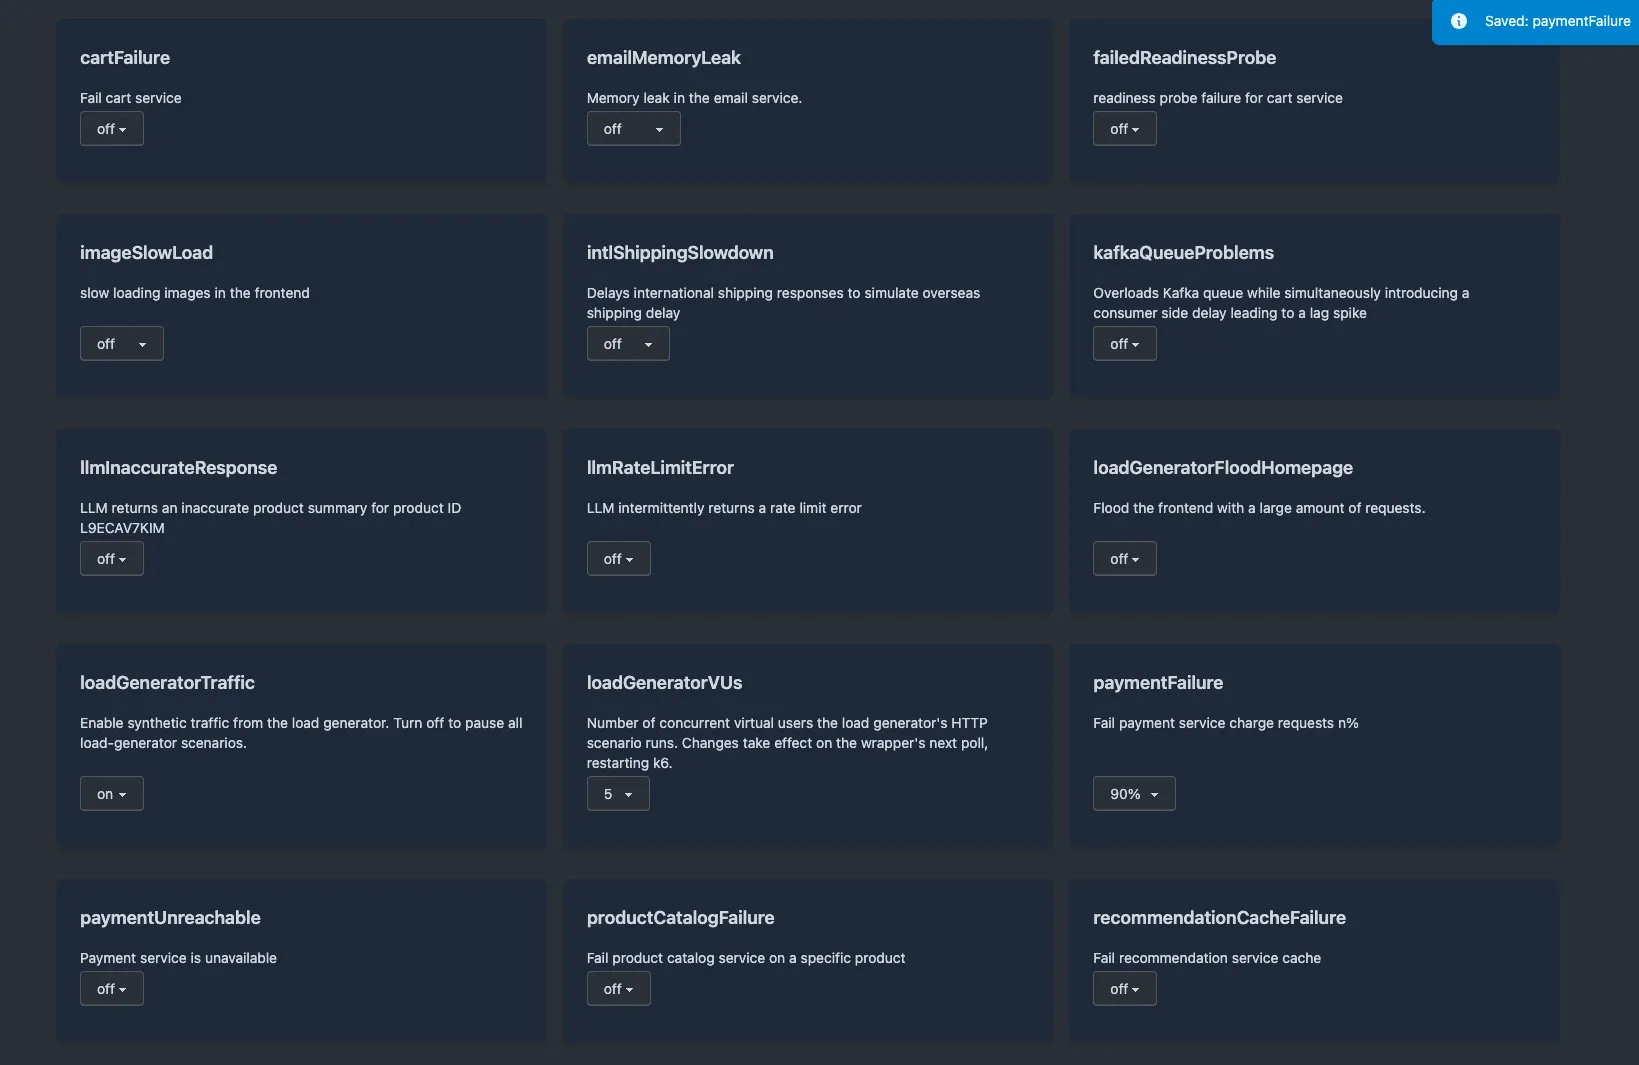
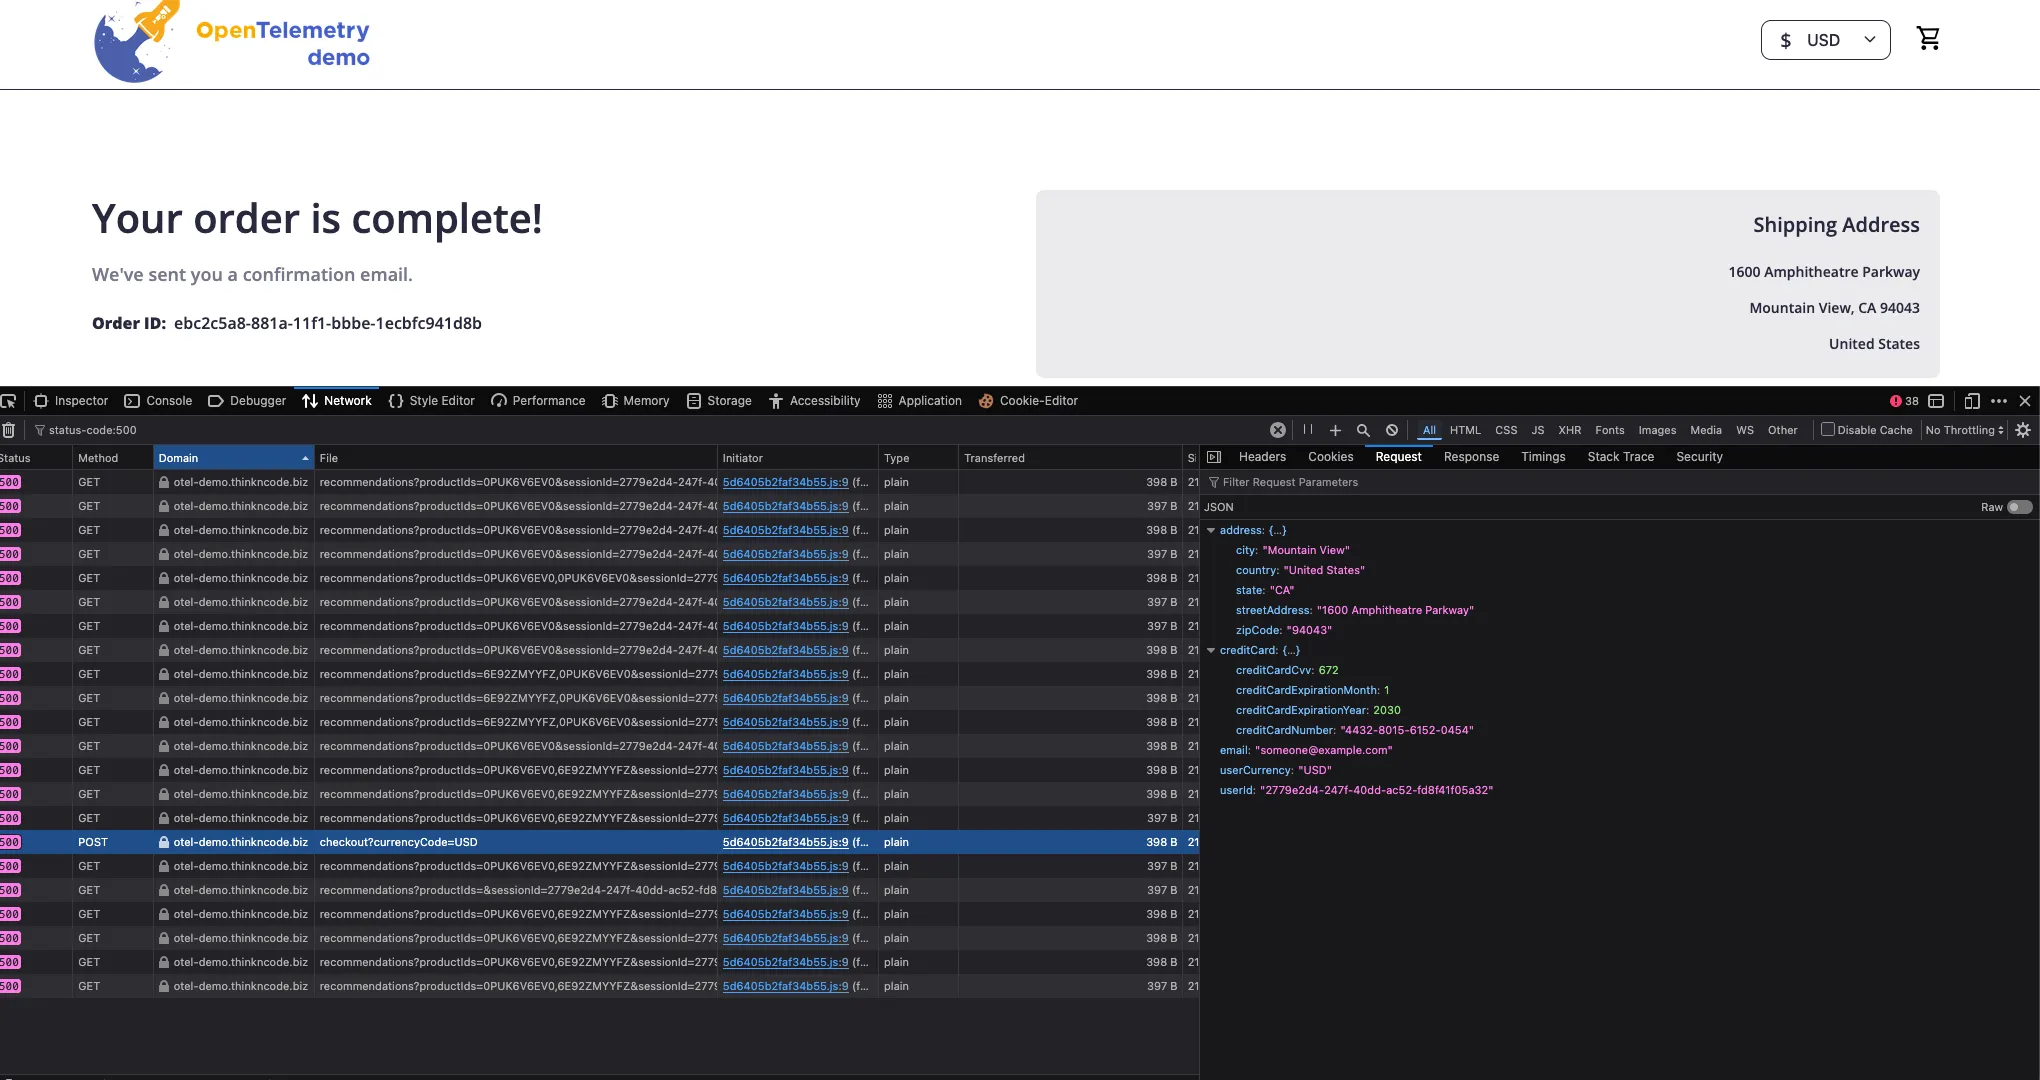
The synthetic load generator runs continuous checkout flows. Payment failures surface immediately in the API:
Alerts fire#
Two alerts are provisioned in the OpenTelemetryDemo.1m group, evaluated every minute.
CheckoutServiceHighErrorRate monitors the ratio of non-zero gRPC responses on the checkout server:
sum(rate(rpc_server_duration_milliseconds_count{
  service_namespace="opentelemetry-demo",
  service_name="checkout",
  rpc_grpc_status_code!="0"
}[5m]))
/
sum(rate(rpc_server_duration_milliseconds_count{
  service_namespace="opentelemetry-demo",
  service_name="checkout"
}[5m]))
Threshold: > 0.5. Fires when more than half of all PlaceOrder calls fail.
PaymentServiceChargeHighFailureRate scopes to the checkout service’s outbound calls to oteldemo.PaymentService/Charge:
sum(rate(rpc_client_duration_milliseconds_count{
  service_namespace="opentelemetry-demo",
  service_name="checkout",
  rpc_service="oteldemo.PaymentService",
  rpc_method="Charge",
  rpc_grpc_status_code!="0"
}[5m]))
/
sum(rate(rpc_client_duration_milliseconds_count{
  service_namespace="opentelemetry-demo",
  service_name="checkout",
  rpc_service="oteldemo.PaymentService",
  rpc_method="Charge"
}[5m]))
Threshold: > 0.5. When this fires alongside CheckoutServiceHighErrorRate, the payment service is confirmed as the failing dependency before any trace is opened.
All rpc_* metrics use numeric status codes — 0 for OK, 2 (UNKNOWN) for a rejected charge, and 13 (INTERNAL) for the checkout error that propagates from it. The filter rpc_grpc_status_code!="0" captures every non-OK code.
Within one to two minutes both alerts transition Normal → Pending. After one additional minute they become Firing.
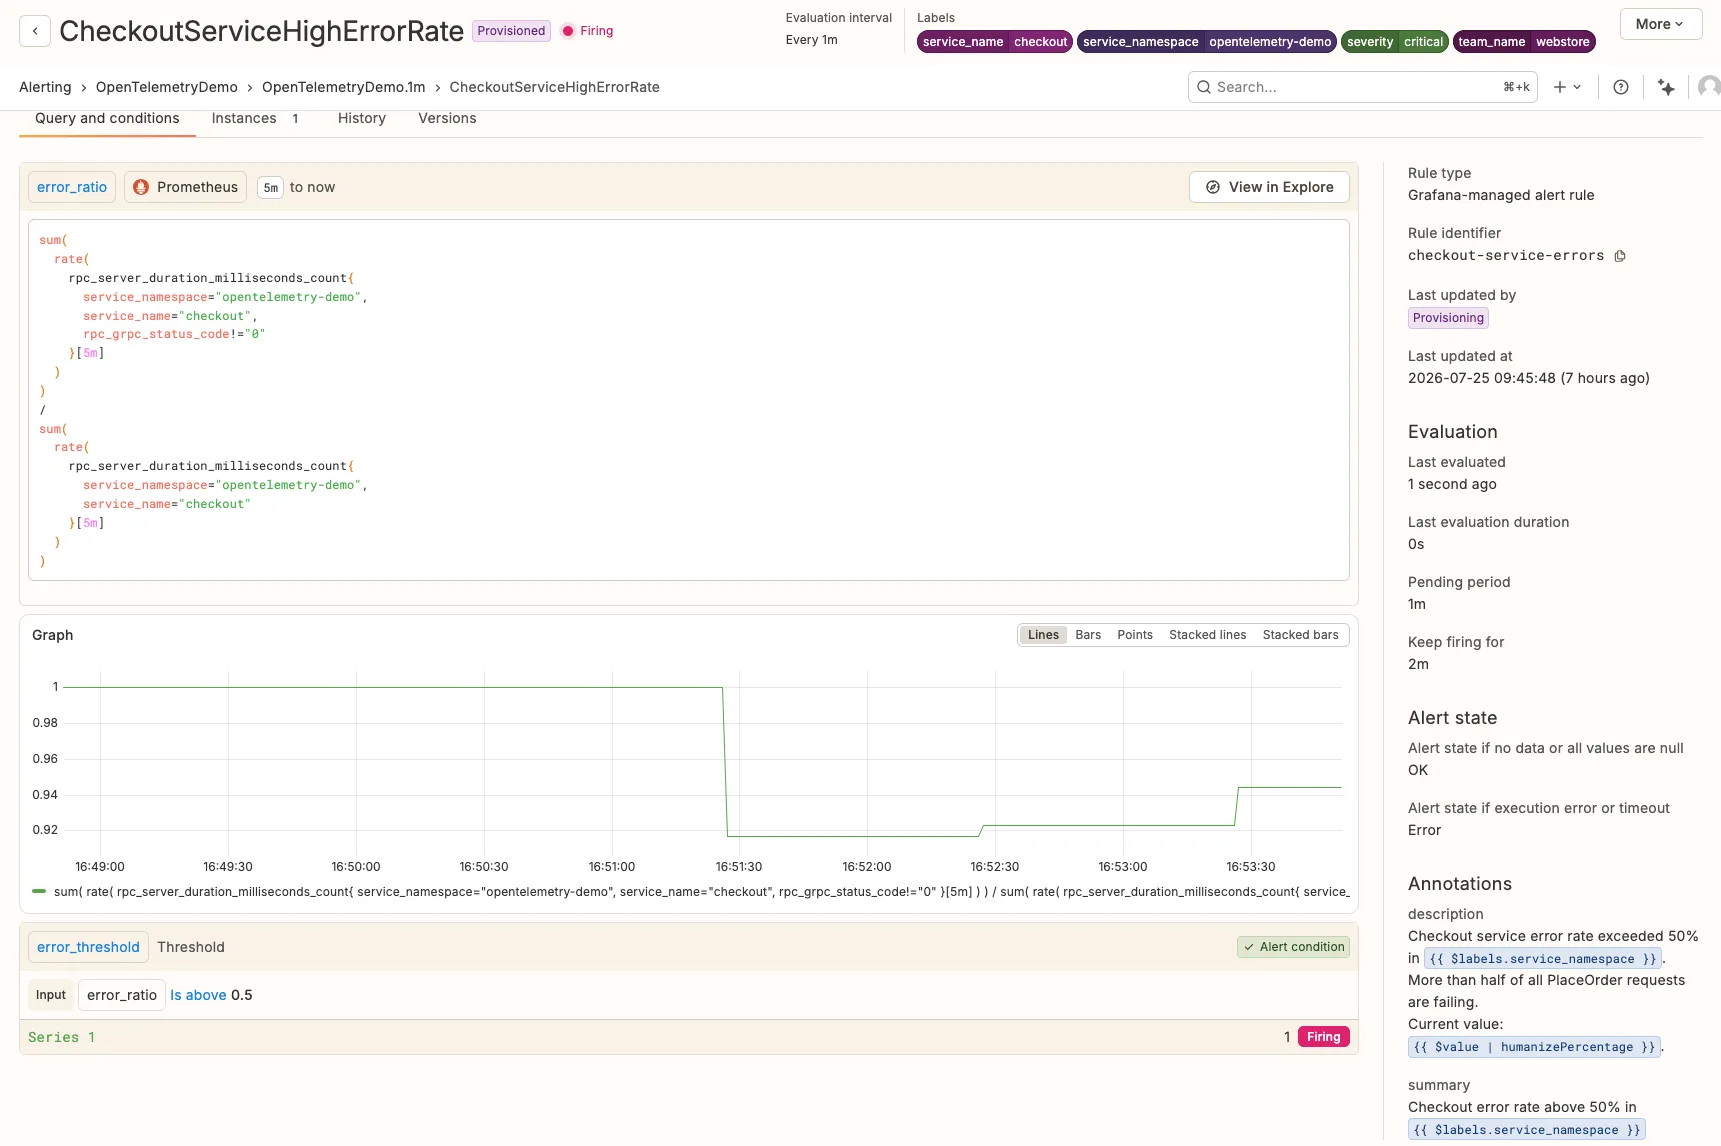
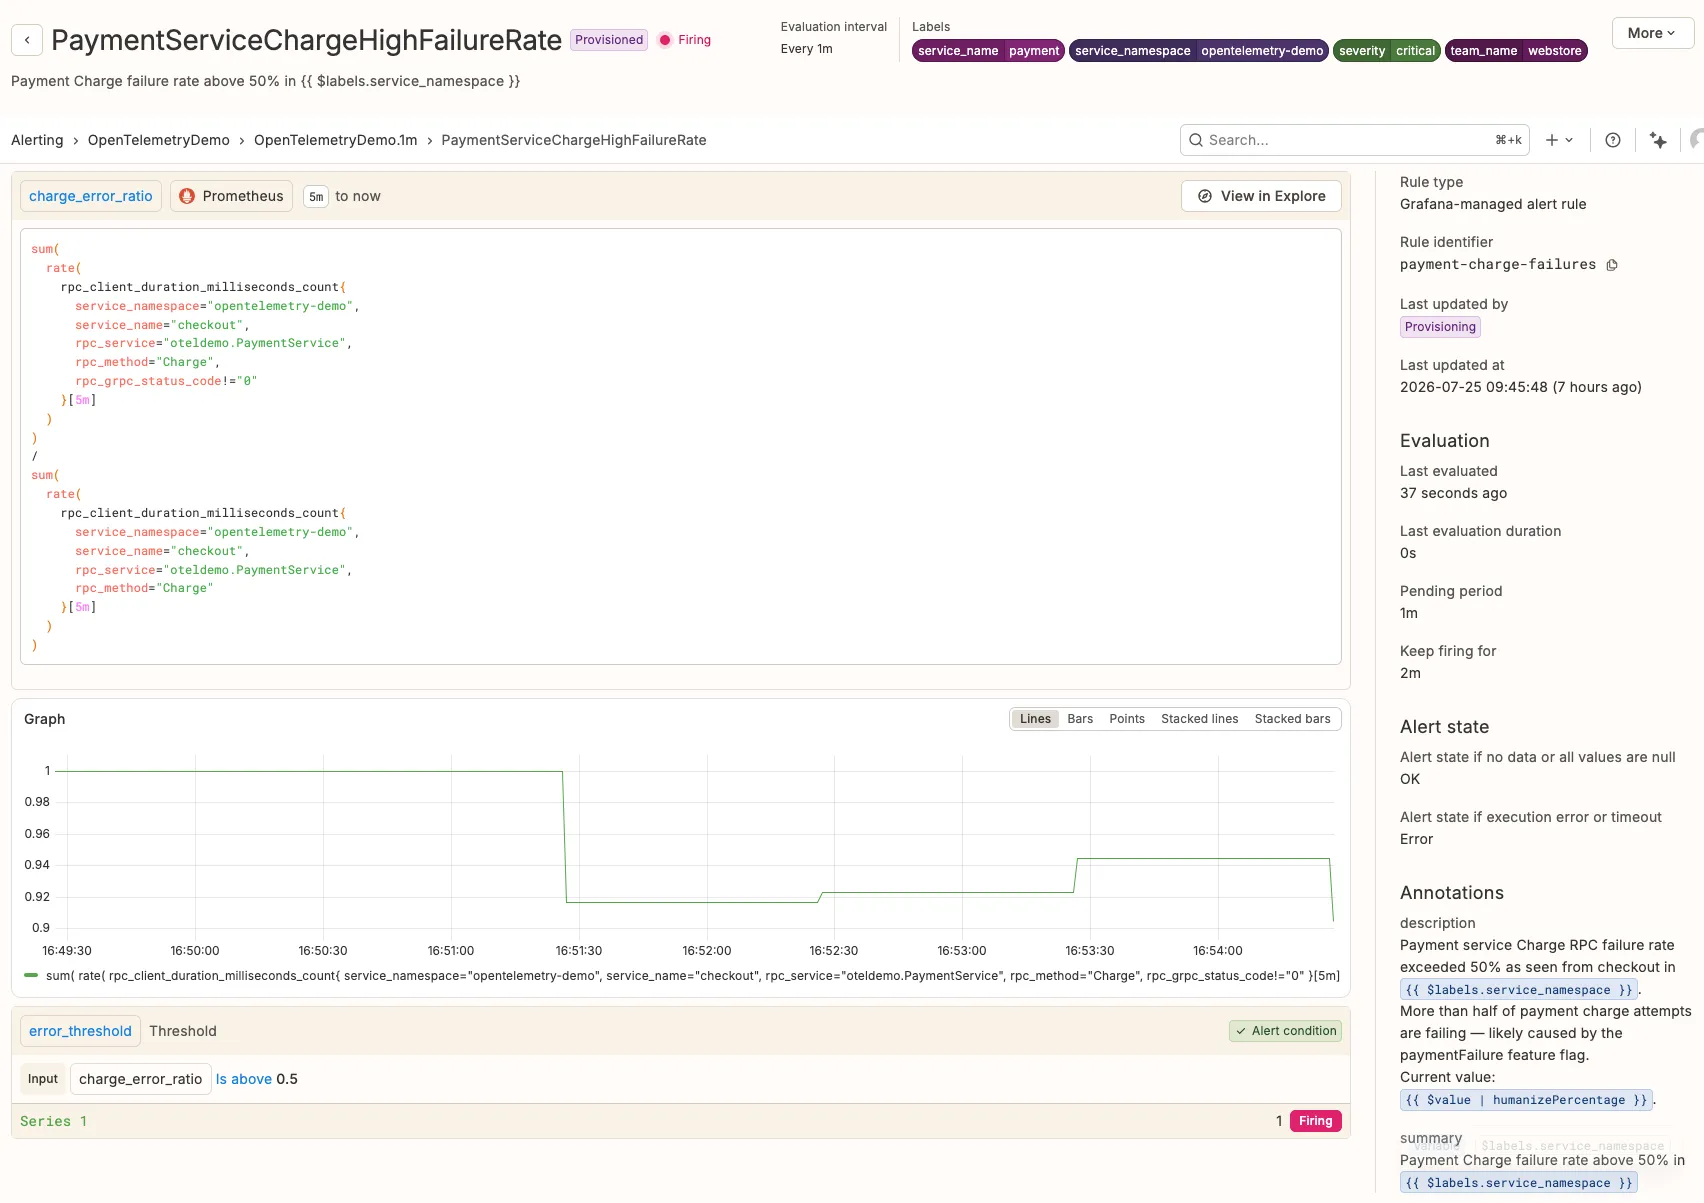
Two data points from metrics alone: users cannot complete checkout, and the payment charge call is the failure point. The second alert is what prevents the investigation from spending time on the wrong service — the investigation starts here.
Step 1 — Scoping: metrics confirm the failure#
Open Explore and select the Prometheus datasource. Run the breakdown query to see status codes in motion:
sum(rate(rpc_server_duration_milliseconds_count{
  service_name="checkout"
}[5m])) by (rpc_grpc_status_code)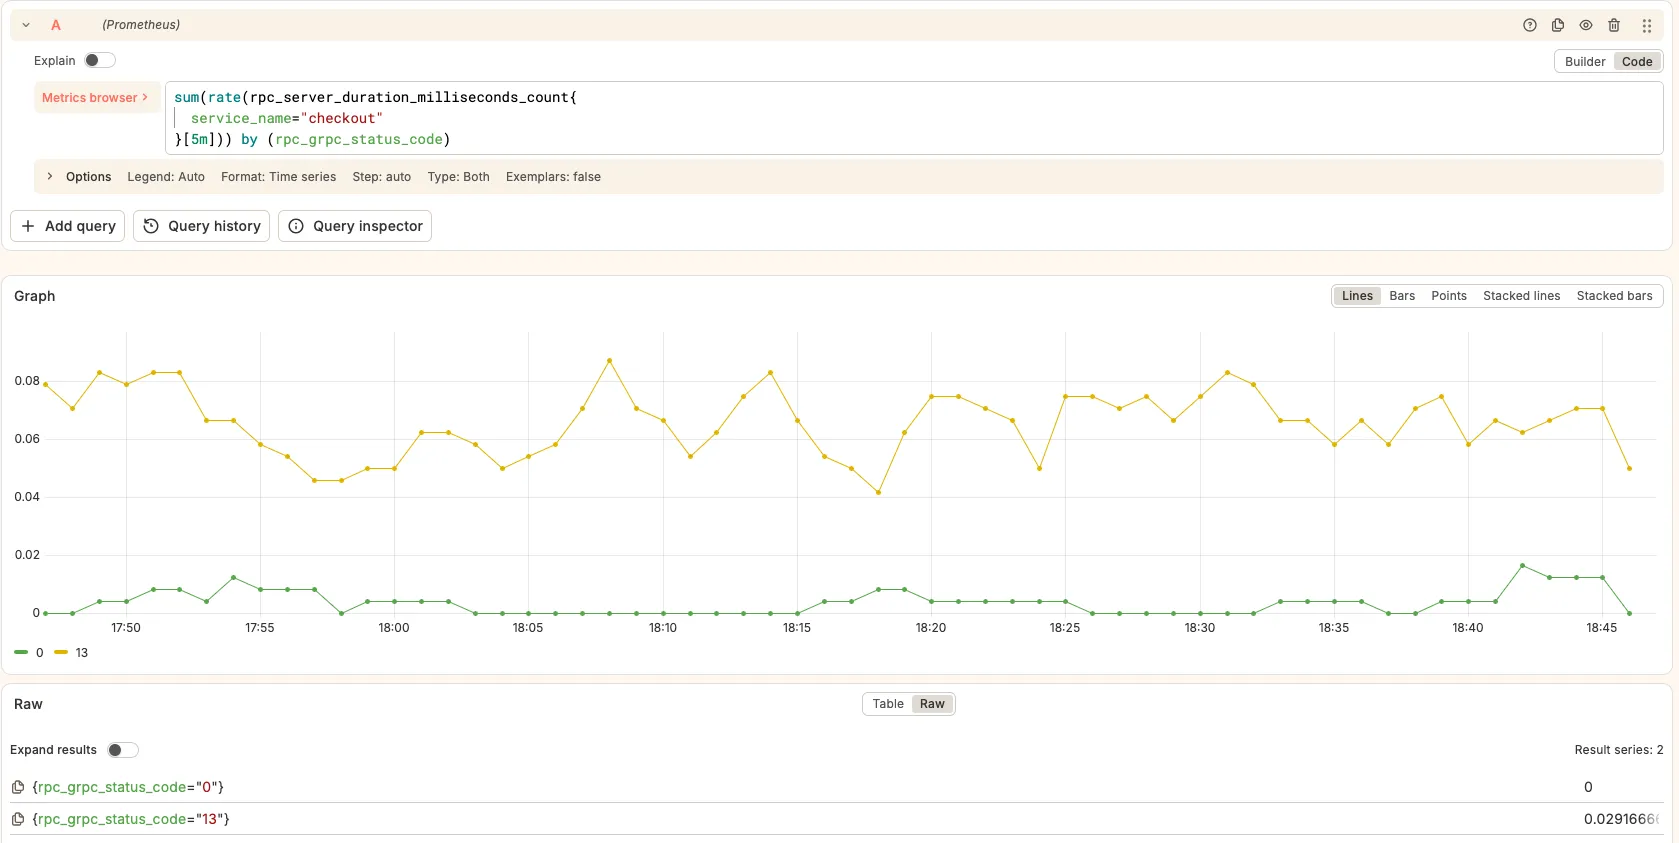
With the flag ON, code 13 (INTERNAL) dominates and code 0 (OK) drops to near zero.
Run the ratio as a range query to find the exact incident start time — the time series shows a sharp step from 0 to ~1.0. That timestamp is when the flag was enabled.
Confirm the dependency with the payment-scoped breakdown:
sum(rate(rpc_client_duration_milliseconds_count{
  service_name="checkout",
  rpc_service="oteldemo.PaymentService",
  rpc_method="Charge"
}[5m])) by (rpc_grpc_status_code)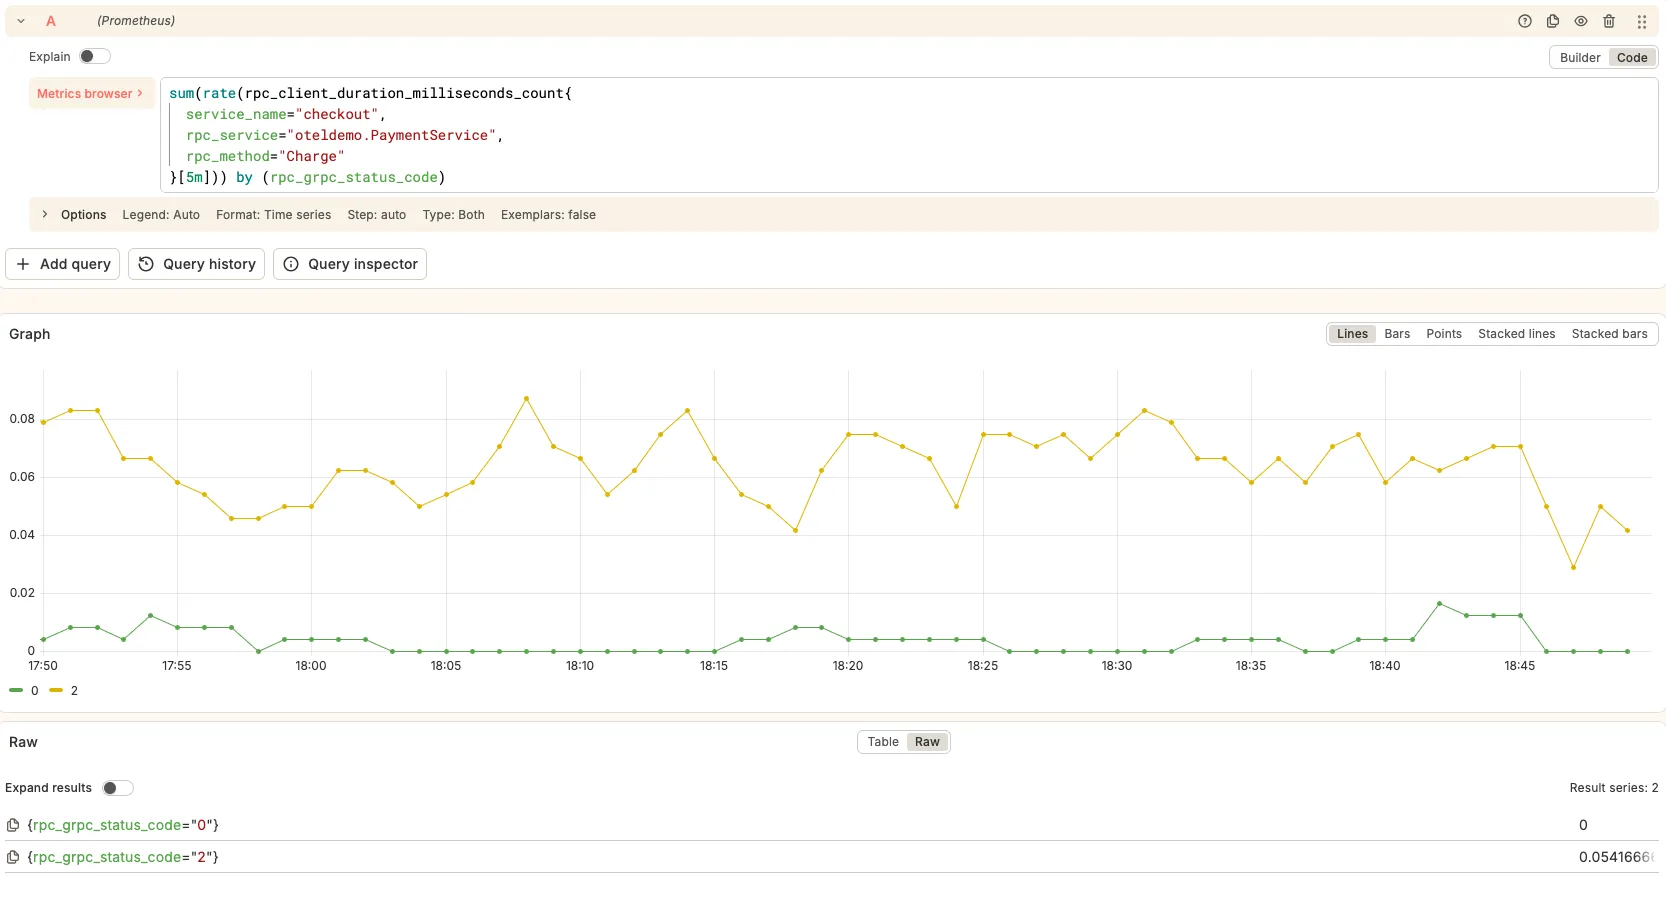
Status code 2 (UNKNOWN) rises as code 0 (OK) disappears, confirming that the Charge RPC itself is failing, not something inside checkout.
Step 2 — Trace isolation: find the exact span#
There are two ways to reach a failing trace. Both land on the same Tempo waterfall.
From Tempo: Switch to the Tempo datasource in Explore and use TraceQL to find failed checkout spans during the incident window:
{ span.service.name = "checkout" && status = error }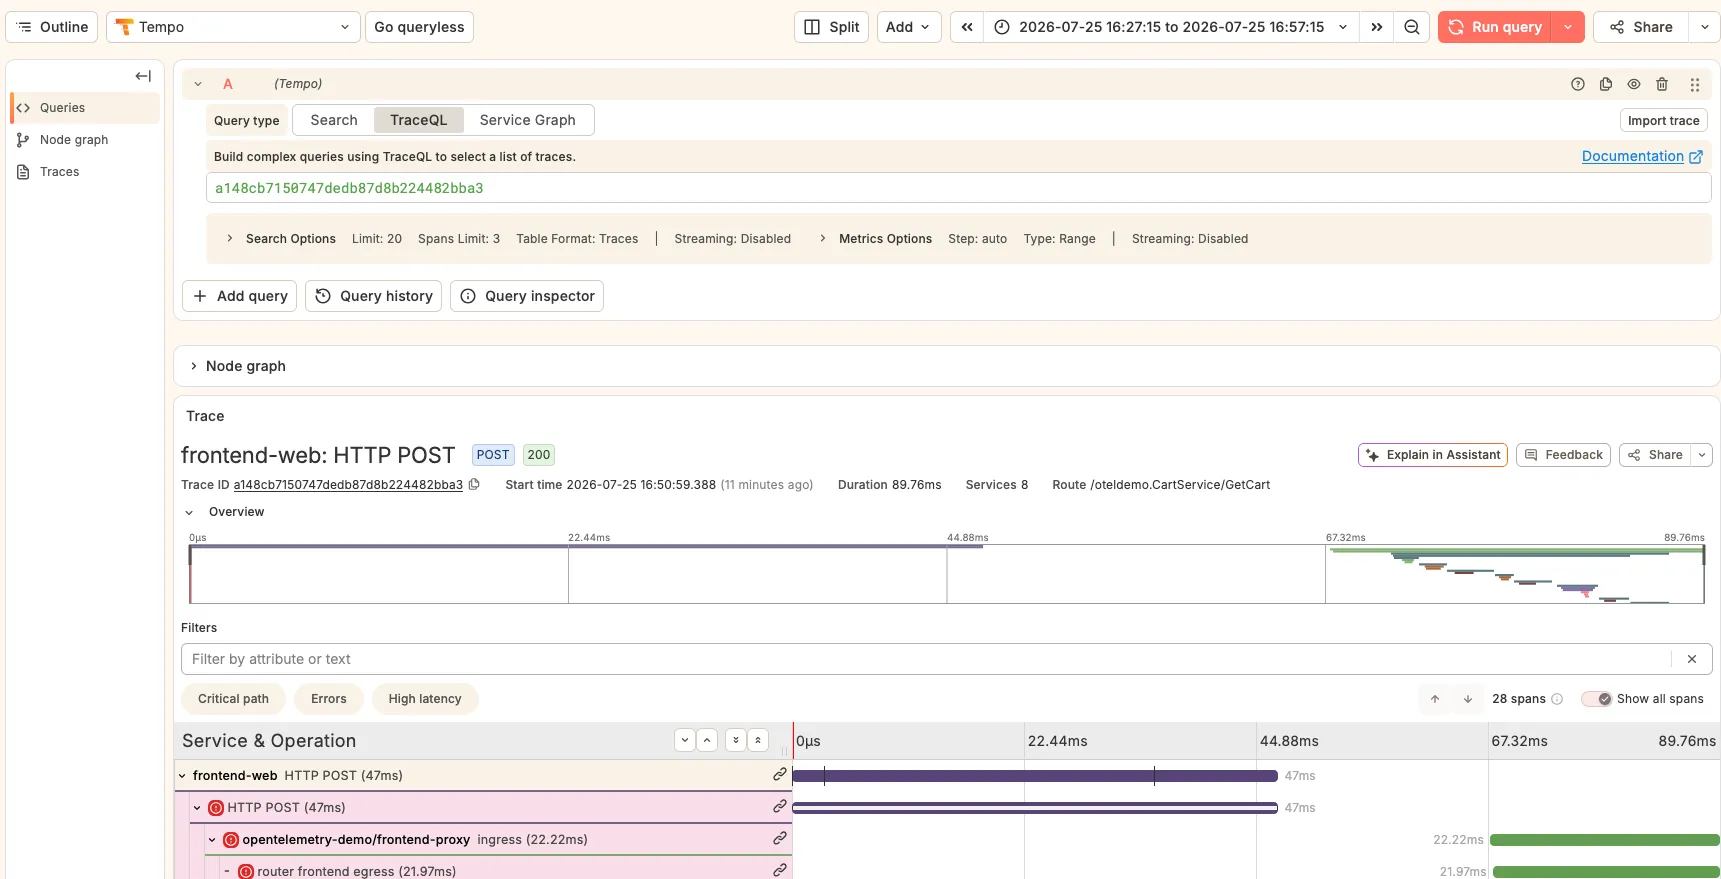
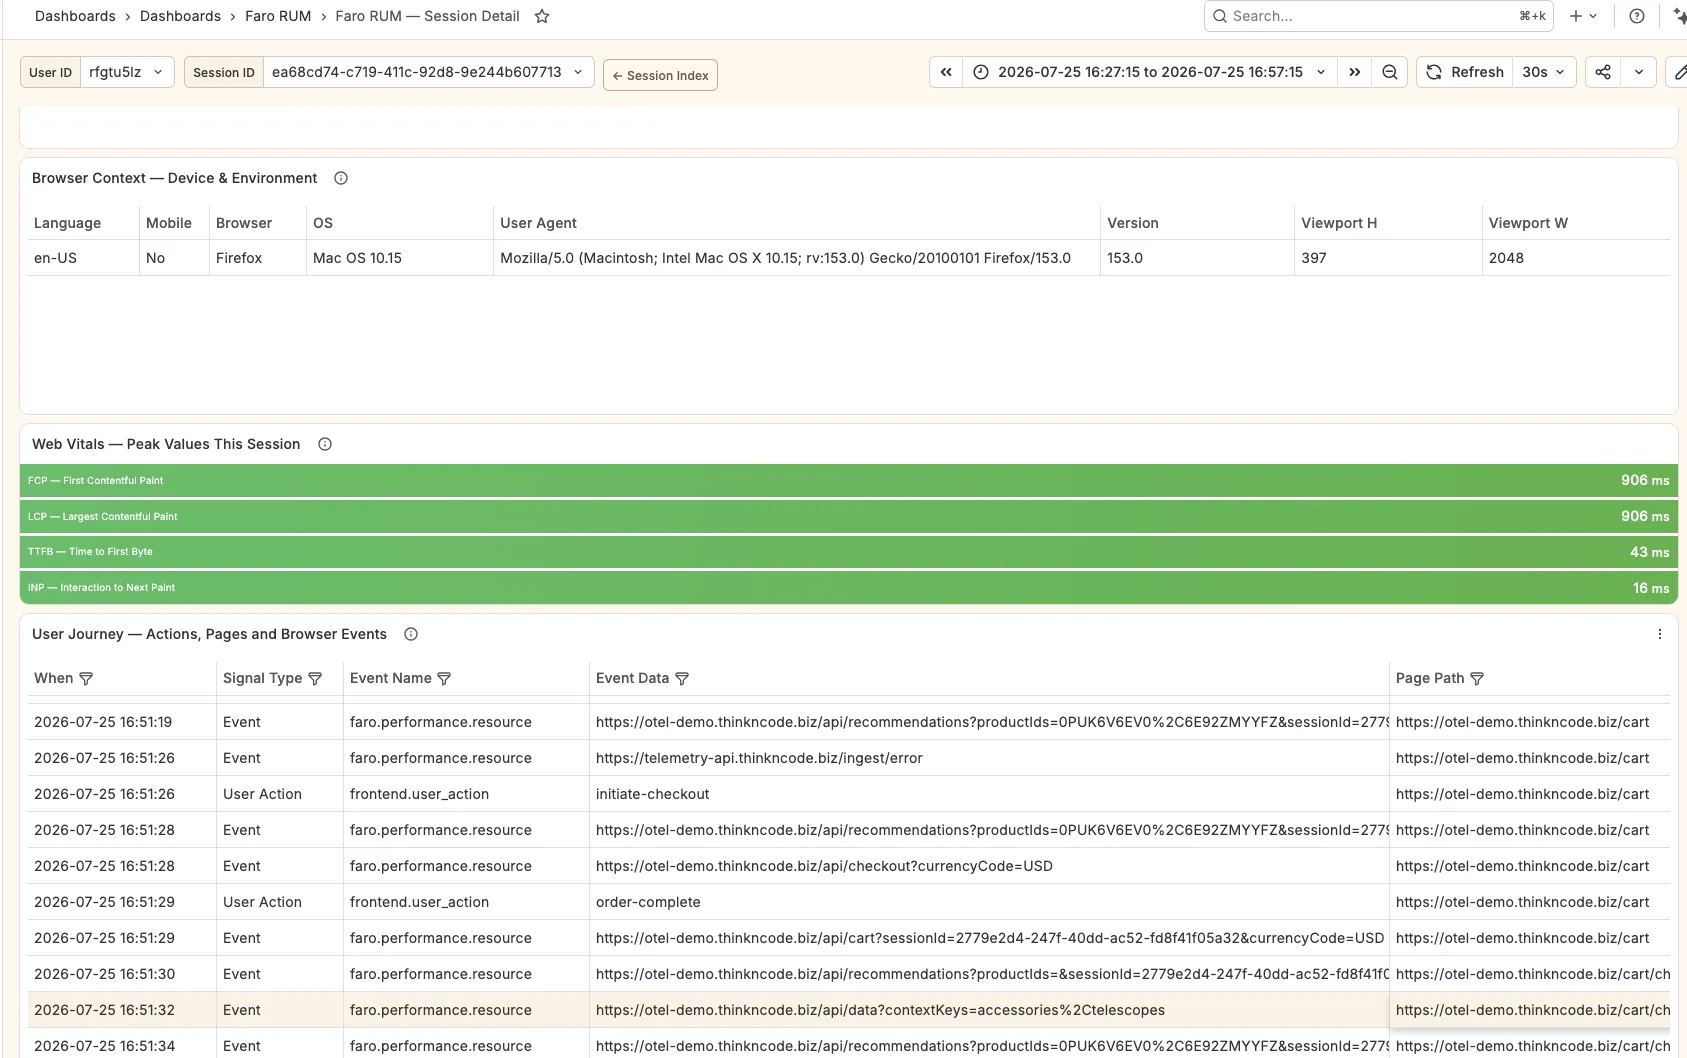
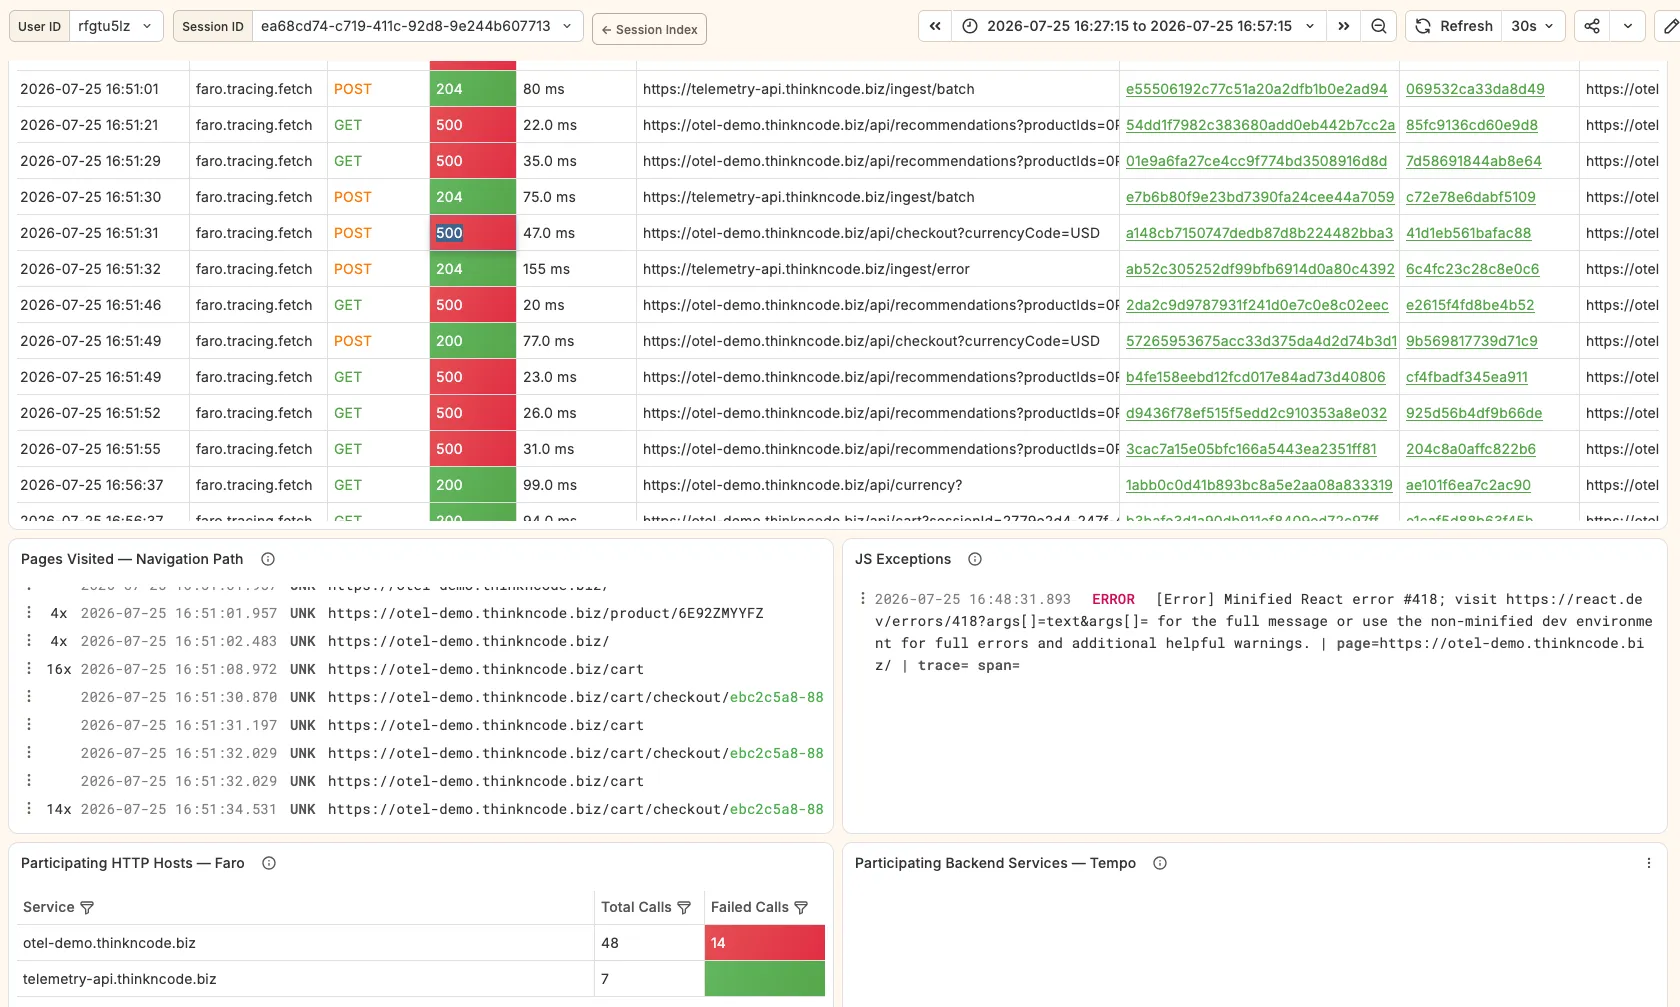
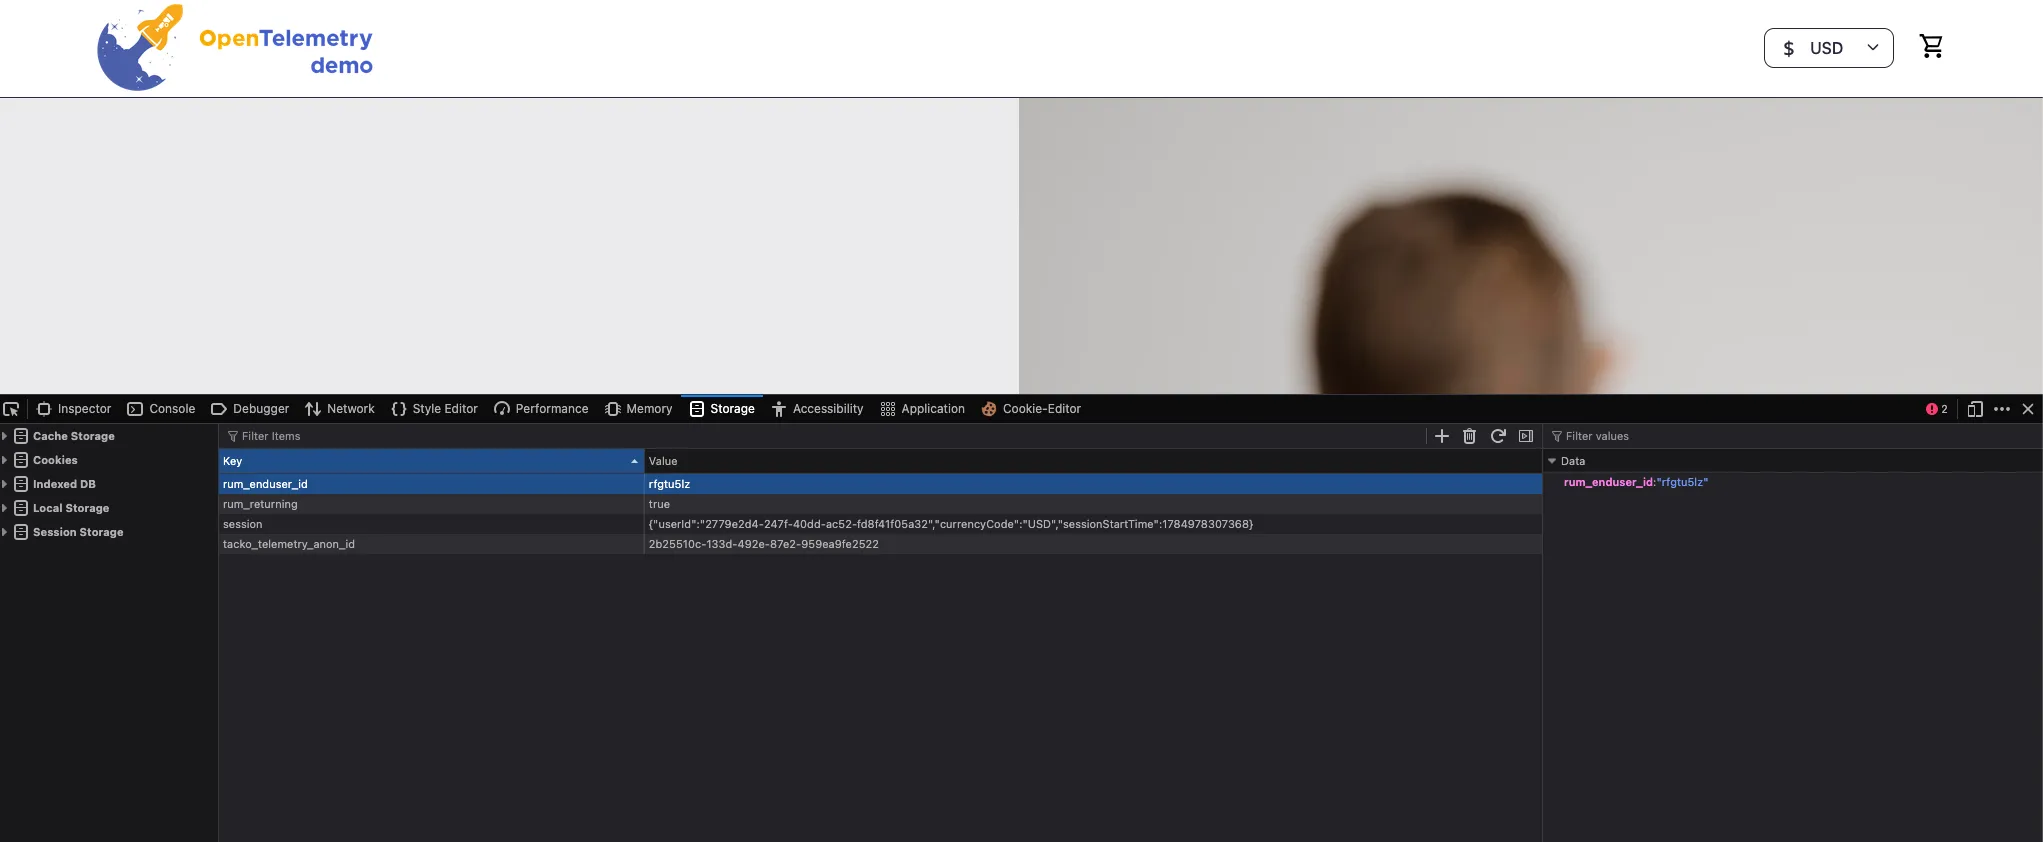
From the Faro browser dashboard: The Faro error table shows the same payment failures from the browser side. Each error row carries a trace ID — clicking it opens the matching Tempo trace directly, without running a TraceQL query.
Either path leads to the same waterfall. Open any result:
checkout  PlaceOrder                    ████████████████████  ERROR
  ├─ cart       GetCart                 ██                    OK
  ├─ product-catalog  GetProduct        ██                    OK (×n)
  ├─ currency   Convert                 █                     OK
  ├─ payment    Charge                  █                     ERROR  ←
  └─ ...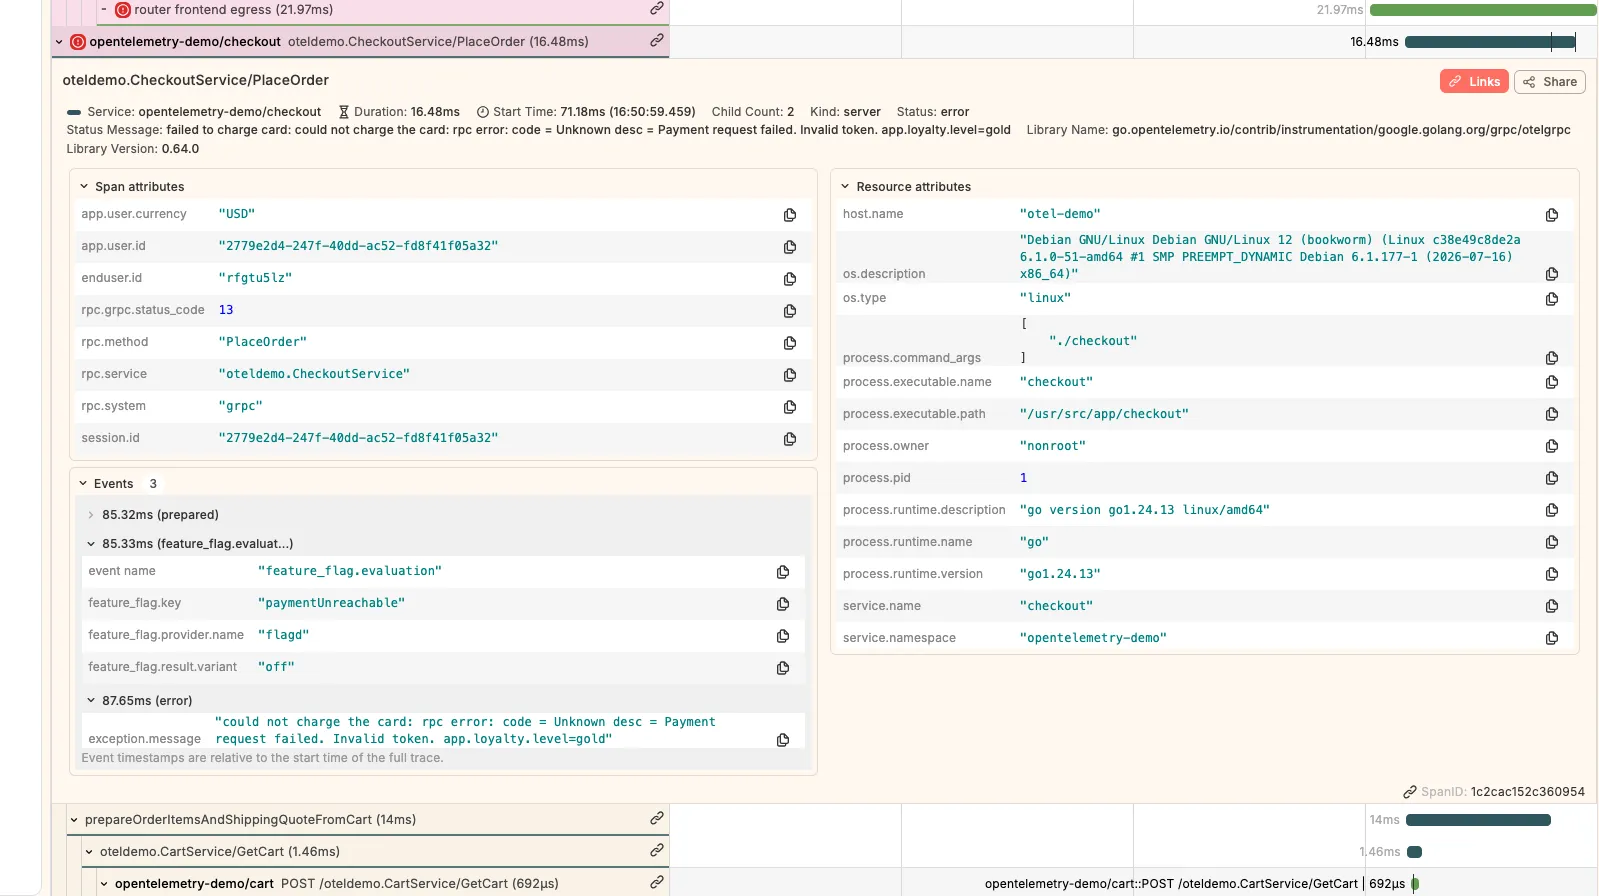
The payment / Charge span attributes confirm:
rpc.system           = grpc
rpc.service          = oteldemo.PaymentService
rpc.method           = Charge
rpc.grpc.status_code = 2
Status code 2 matches the metric label from step 1. The checkout span inherits the error and returns code 13 (INTERNAL) — exactly what CheckoutServiceHighErrorRate measured.
Step 3 — Log evidence: logs for the failing span#
Click Logs for this span on the red payment / Charge span.
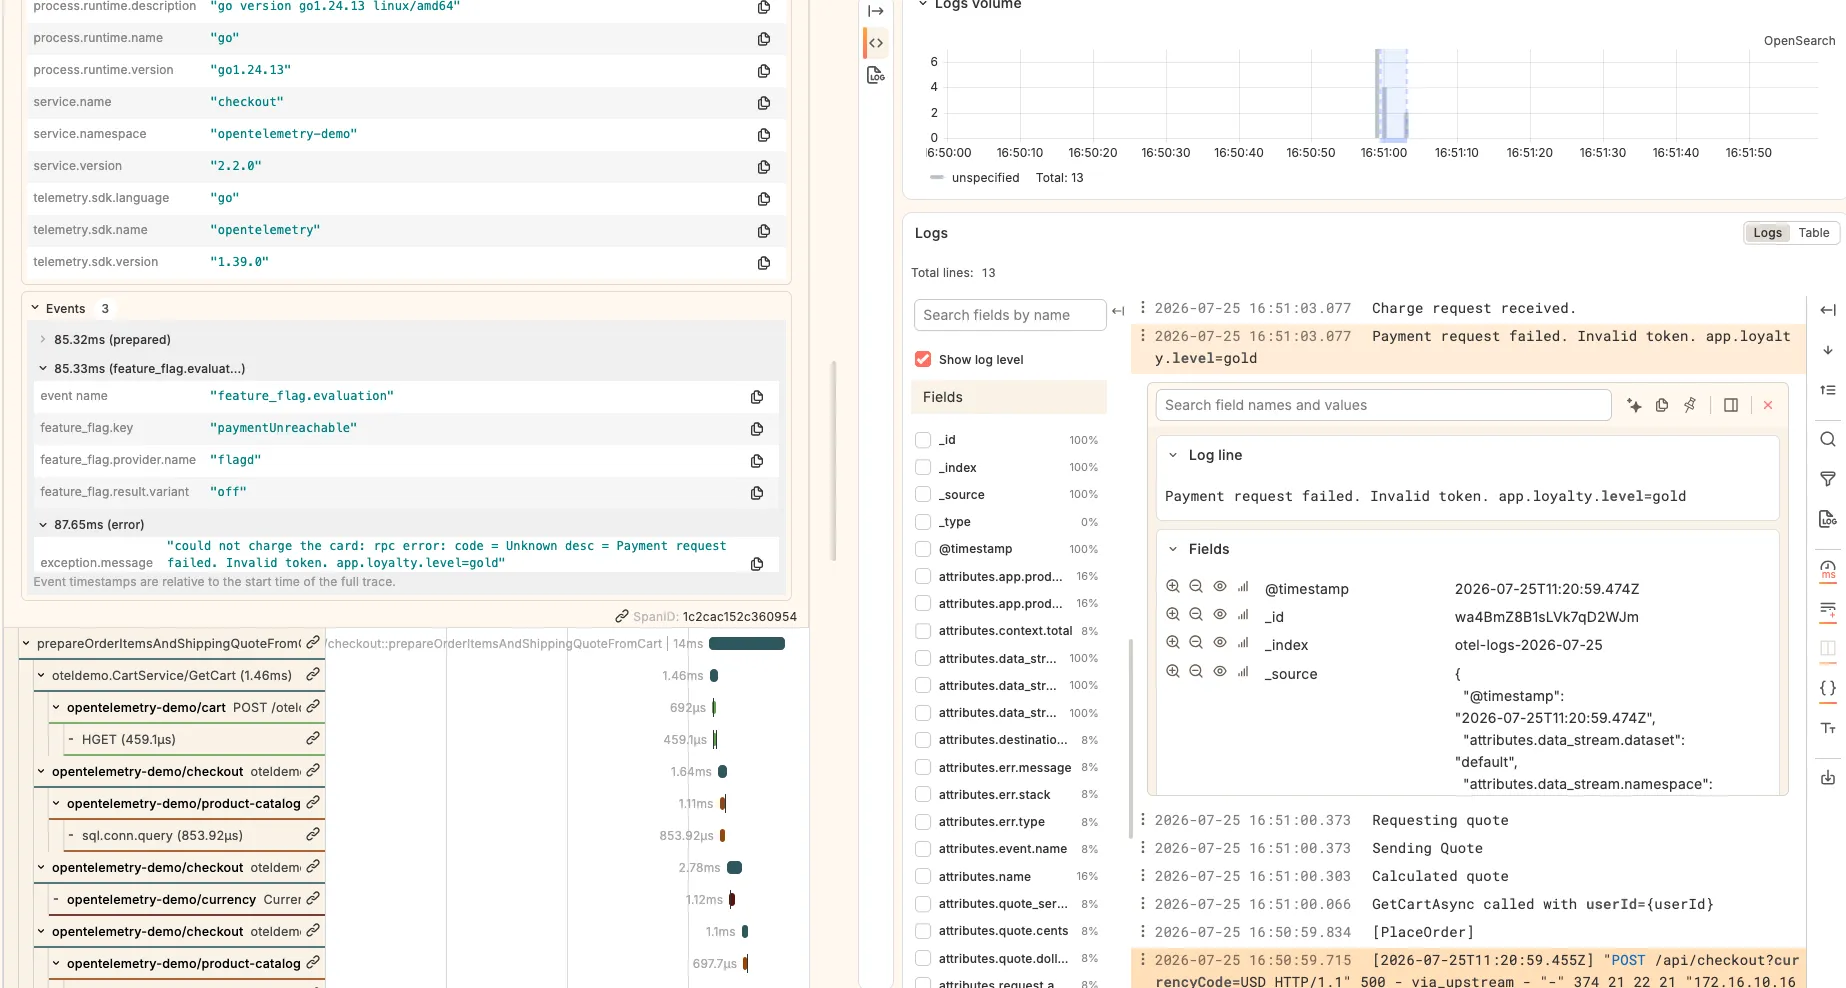
Grafana opens OpenSearch using the configured tracesToLogsV2 custom query:
traceId: "<trace-id-from-span>"Backend service logs are stored in the otel-logs-* index in OpenSearch, shipped by the OTel Collector via OTLP. Each log record carries trace and span ID from the active request context:
{
  "timestamp": "2026-07-25 16:51:03.077",
  "timeEpochMs": 1784978463077,
  "timeEpochNs": "1784978463077000000",
  "timeLocal": "2026-07-25 16:51:03",
  "timeUtc": "2026-07-25 11:21:03",
  "timeFromNow": "2 hours ago",
  "logLevel": "",
  "displayLevel": "",
  "line": "Payment request failed. Invalid token. app.loyalty.level=gold",
  "fields": {
    "@timestamp": "2026-07-25T11:20:59.474Z",
    "_id": "wa4BmZ8B1sLVk7qD2WJm",
    "_index": "otel-logs-2026-07-25",
    "_source": {
      "@timestamp": "2026-07-25T11:20:59.474Z",
      "attributes.data_stream.dataset": "default",
      "attributes.data_stream.namespace": "namespace",
      "attributes.data_stream.type": "record",
      "attributes.err.message": "Payment request failed. Invalid token. app.loyalty.level=gold",
      "attributes.err.stack": "Error: Payment request failed. Invalid token. app.loyalty.level=gold\n    at module.exports.charge (/usr/src/app/charge.js:37:13)\n    at process.processTicksAndRejections (node:internal/process/task_queues:105:5)\n    at async Object.chargeServiceHandler [as charge] (/usr/src/app/index.js:21:22)",
      "attributes.err.type": "Error",
      "body": "Payment request failed. Invalid token. app.loyalty.level=gold",
      "instrumentationScope.name": "payment-logger",
      "instrumentationScope.version": "1.0.0",
      "observedTimestamp": "2026-07-25T11:21:03.077743612Z",
      "resource.host.arch": "amd64",
      "resource.host.name": "otel-demo",
      "resource.os.type": "linux",
      "resource.os.version": "6.1.0-51-amd64",
      "resource.process.command": "/usr/src/app/node_modules/thread-stream/lib/worker.js",
      "resource.process.command_args": "[\"/nodejs/bin/node\",\"--require=./opentelemetry.js\",\"/usr/src/app/node_modules/thread-stream/lib/worker.js\"]",
      "resource.process.executable.name": "/nodejs/bin/node",
      "resource.process.executable.path": "/nodejs/bin/node",
      "resource.process.owner": "nonroot",
      "resource.process.pid": "1",
      "resource.process.runtime.description": "Node.js",
      "resource.process.runtime.name": "nodejs",
      "resource.process.runtime.version": "22.22.0",
      "resource.service.name": "payment",
      "resource.service.namespace": "opentelemetry-demo",
      "resource.service.version": "2.2.0",
      "severity.number": 13,
      "severity.text": "warn",
      "spanId": "e6c40c5e457dd21e",
      "traceId": "a148cb7150747dedb87d8b224482bba3"
    },
    "attributes.data_stream.dataset": "default",
    "attributes.data_stream.namespace": "namespace",
    "attributes.data_stream.type": "record",
    "attributes.err.message": "Payment request failed. Invalid token. app.loyalty.level=gold",
    "attributes.err.stack": "Error: Payment request failed. Invalid token. app.loyalty.level=gold\n    at module.exports.charge (/usr/src/app/charge.js:37:13)\n    at process.processTicksAndRejections (node:internal/process/task_queues:105:5)\n    at async Object.chargeServiceHandler [as charge] (/usr/src/app/index.js:21:22)",
    "attributes.err.type": "Error",
    "instrumentationScope.name": "payment-logger",
    "instrumentationScope.version": "1.0.0",
    "resource.host.arch": "amd64",
    "resource.host.name": "otel-demo",
    "resource.os.type": "linux",
    "resource.os.version": "6.1.0-51-amd64",
    "resource.process.command": "/usr/src/app/node_modules/thread-stream/lib/worker.js",
    "resource.process.command_args": [
      "/nodejs/bin/node",
      "--require=./opentelemetry.js",
      "/usr/src/app/node_modules/thread-stream/lib/worker.js"
    ],
    "resource.process.executable.name": "/nodejs/bin/node",
    "resource.process.executable.path": "/nodejs/bin/node",
    "resource.process.owner": "nonroot",
    "resource.process.pid": "1",
    "resource.process.runtime.description": "Node.js",
    "resource.process.runtime.name": "nodejs",
    "resource.process.runtime.version": "22.22.0",
    "resource.service.name": "payment",
    "resource.service.namespace": "opentelemetry-demo",
    "resource.service.version": "2.2.0",
    "severity.number": "13",
    "severity.text": "warn",
    "spanId": "e6c40c5e457dd21e",
    "traceId": "a148cb7150747dedb87d8b224482bba3"
  }
}
The traceId in the log matches the trace ID in Tempo. The error message PaymentError: payment unavailable points directly to the feature flag condition in the payment service code.
Step 4 — Trace-to-metrics: confirm scope from a span#
When a trace span is open in Tempo, the configured correlation links appear as clickable actions — Logs for this span (opens OpenSearch), Error rate and Request rate (open Prometheus span metric queries), and links to any other configured datasource:
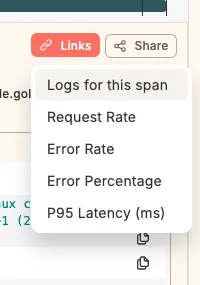
From the same trace view, click the Metrics link on the payment / Charge span.
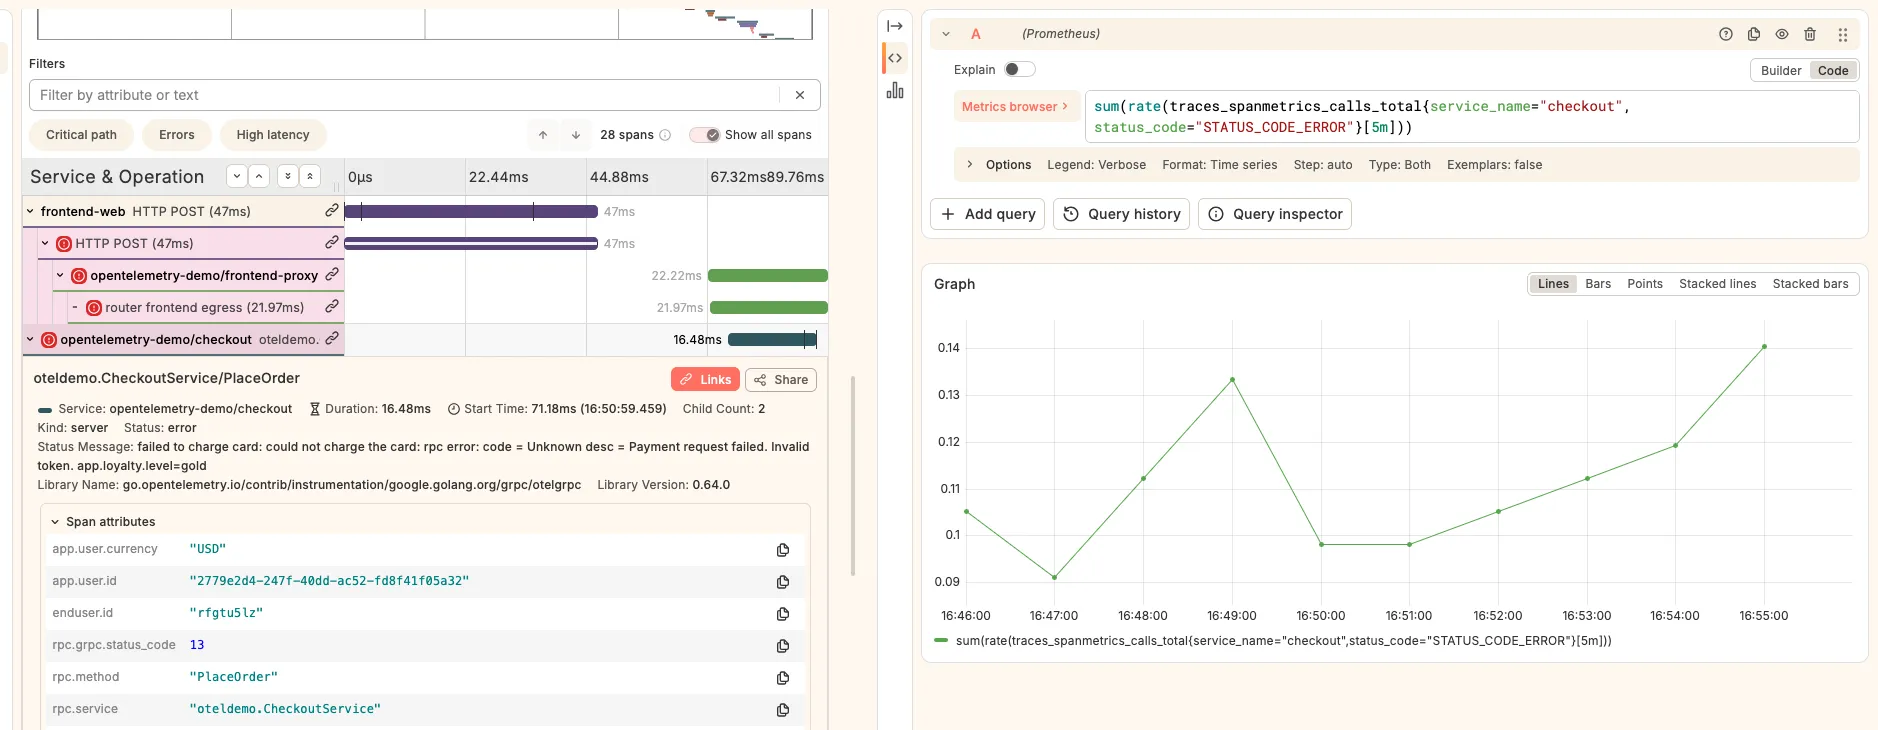
Step 5 — Resolution#
Return to Flagd and set paymentFailure back to off.
Both alerts transition Firing → Normal within two to three minutes as the 5-minute rate window clears. The keepFiringFor: 2m setting holds alerts active for two additional minutes after the condition resolves, giving time to confirm the fix before the alert clears.
Investigation summary#
Phase          Signal              Observation
───────────────────────────────────────────────────────────────────────
Detection      Grafana Alerting    Two alerts Pending → Firing
Step 1         Prometheus          Status code 13 on checkout; ratio 1.00
Step 2         Tempo               payment/Charge span: error, status 2
Step 3         OpenSearch          "PaymentError: payment unavailable"
Step 4         Prometheus          Span metrics confirm error rate from trace
Step 5         Grafana Alerting    Both alerts resolved after flag OFF
No single signal was sufficient. The first alert told you users were affected. The second alert named the dependency. The trace showed the exact span. The log explained why.
AI-assisted investigation#
Grafana’s built-in AI assistant can follow the same correlation path automatically, reading alert context, querying Tempo for failing traces, and summarising the log evidence.
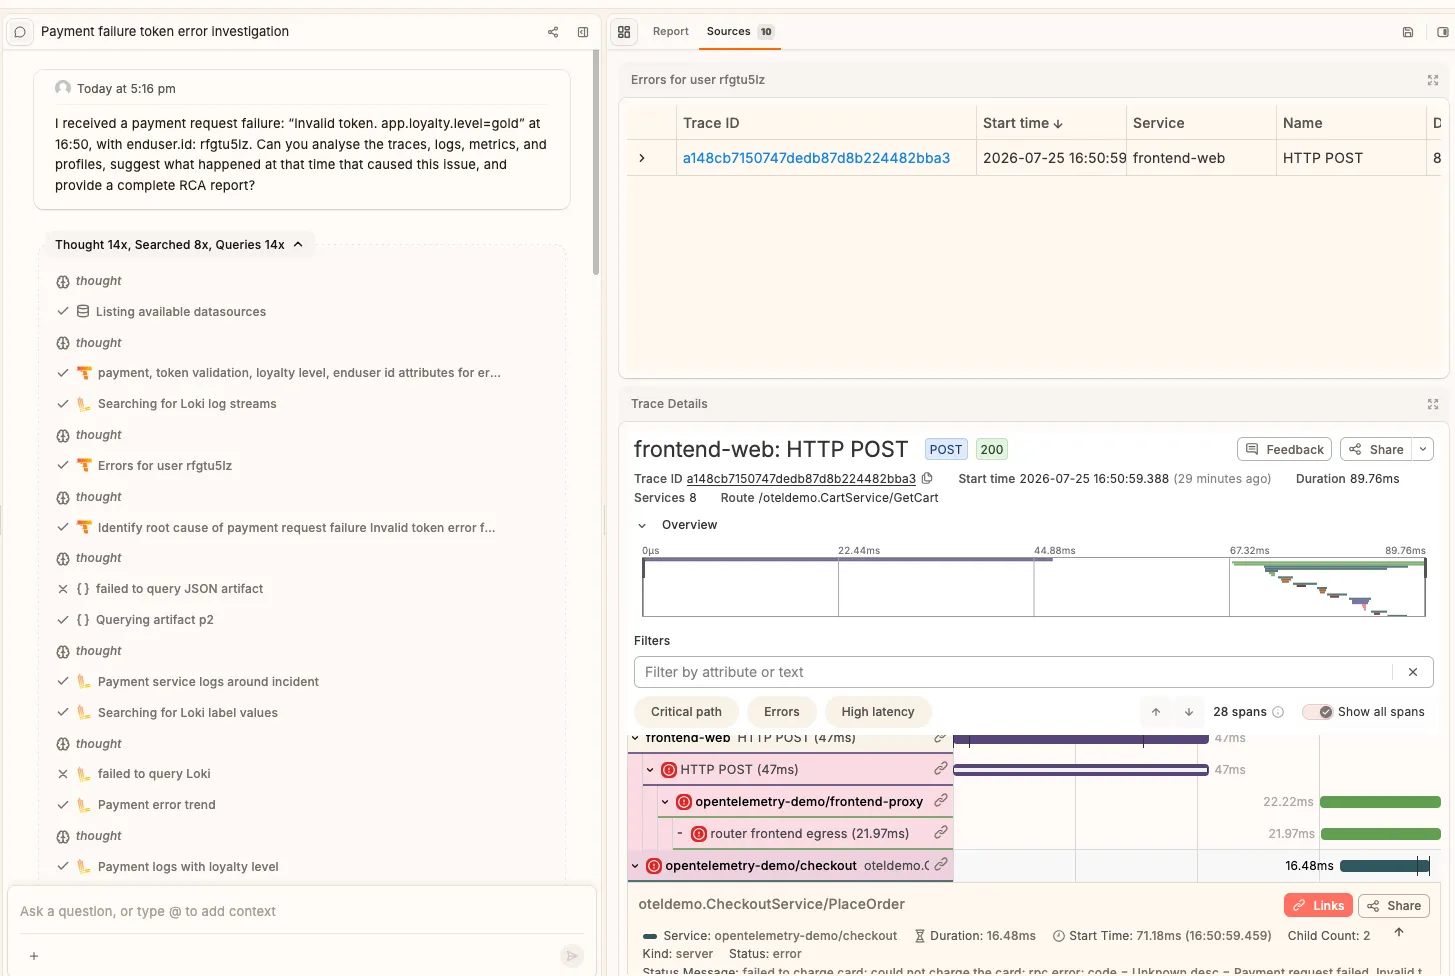
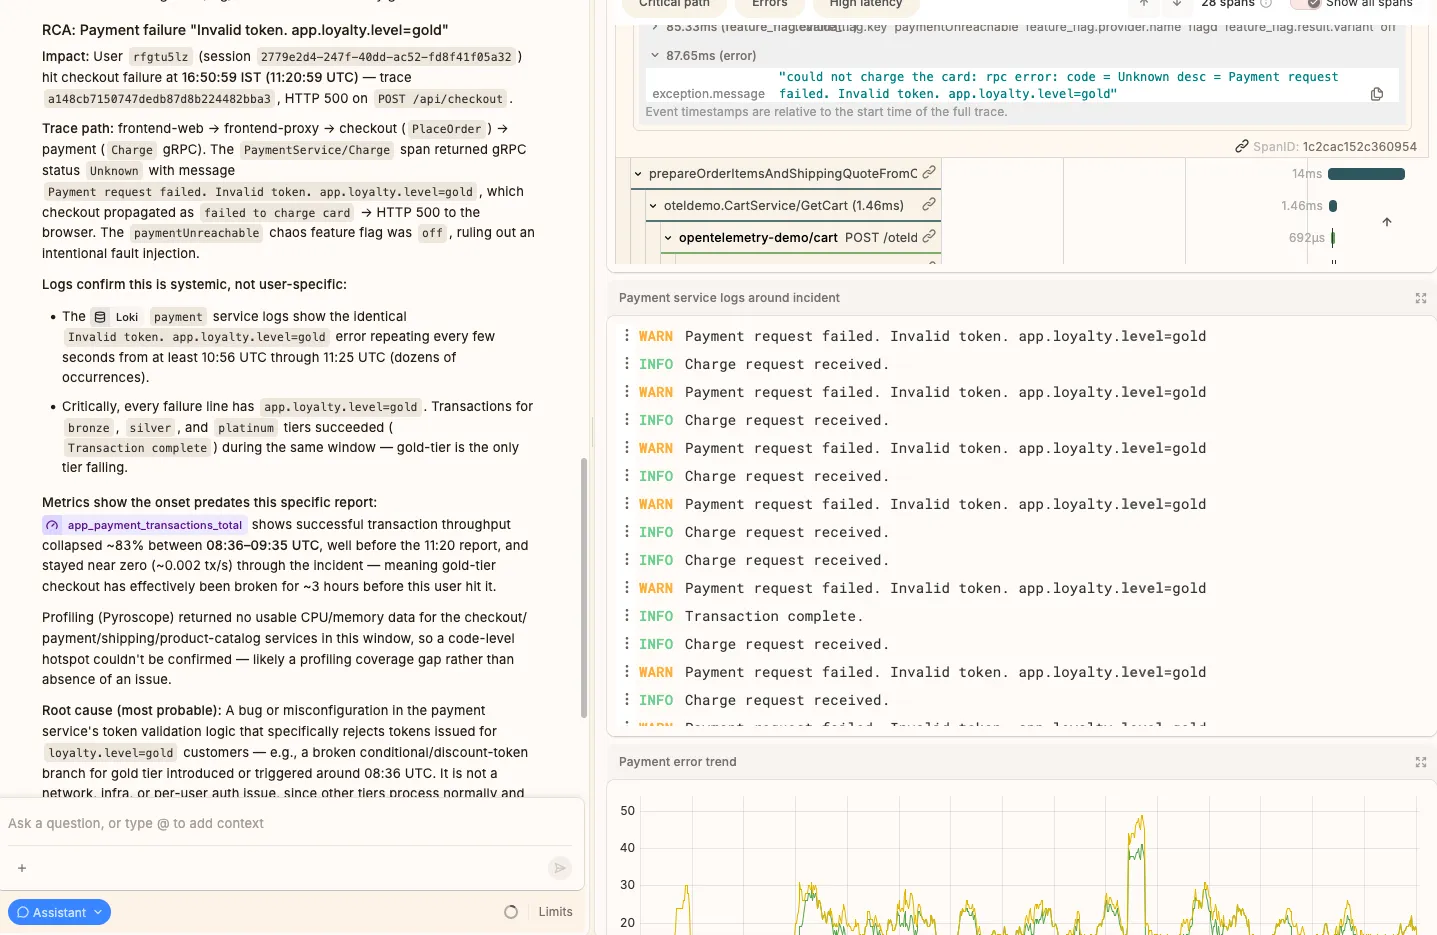
The path the assistant follows is only possible because the telemetry is correctly correlated. The shared trace ID connecting Tempo and OpenSearch is what allows an agent to move from an alert to a root-cause log message in a single query chain.
Can you add profiles to this scenario?#
For a payment failure caused by a feature flag: not meaningfully. Profiles are useful when the problem is resource consumption — CPU, memory, goroutine count. A flag-driven payment failure is a business logic error. The service fails fast and returns an error. There is no CPU spike or memory growth to profile.
Profiles become valuable with these flags instead:
| Flag | Service | What profiles show |
|---|---|---|
adHighCpu | ad | CPU flame graph — which function is hot |
emailMemoryLeak | Heap profile — where allocations are growing | |
adManualGc | ad | GC pause frequency and allocation rate |
To wire trace-to-profile navigation, add a Pyroscope link to the Tempo datasource:
jsonData:
  tracesToProfiles:
    datasourceUid: <pyroscope-datasource-uid>
    tags:
      - key: service.name
        value: service_name
    profileTypeId: process_cpu:cpu:nanoseconds:cpu:nanoseconds
    customQuery: false
With adHighCpu ON, clicking a slow ad service span opens the CPU flame graph for that service at the exact time of the trace — the same correlation model as traces-to-logs, applied to profiling data.
Best practices#
Standardise resource attributes#
Correlation breaks when attribute names differ across backends:
service.name              — use this, not "app" or "application_name"
service.namespace
service.version
deployment.environment.name
k8s.namespace.name
k8s.pod.name
Keep trace IDs out of indexed labels#
Never add these as Loki stream labels or Prometheus label dimensions:
traceId / trace_id / spanId / session_id / request_idThey have unbounded cardinality. Each unique value creates a new Loki stream. Store them as log line fields or structured metadata and filter after the stream selector.
Verify gRPC status code format#
Check whether your OTel SDK exports "0" or "STATUS_CODE_OK" before writing alerts. A mismatch makes the alert always fire or never fire. Run this query and check the label values directly:
count by (rpc_grpc_status_code) (
  rpc_server_duration_milliseconds_count{service_name="checkout"}
)
Use realistic time shifts for correlation links#
Trace-to-logs:    -1m to +1m   (buffer for log shipping delay)
Trace-to-metrics: -5m to +5m   (rate window alignment)
Verify both navigation directions#
Tempo span  → OpenSearch logs     (Logs for this span)
Tempo span  → Prometheus metrics  (trace-to-metrics)
Prometheus  → Tempo trace         (exemplar click-through)
A setup is not complete until every required direction works.
Conclusion#
Telemetry correlation turns separate observability backends into one investigation workflow.
The payment failure investigation went from alert to confirmed root cause in under five minutes:
Alerts fired      → two signals confirmed the symptom and named the dependency
Metrics confirmed → exact start time and status code distribution
Trace showed      → the exact span that failed and its gRPC status
Log explained     → the error message from the service code
The goal is not to collect the maximum amount of telemetry. The goal is to preserve enough shared context — trace ID, service name, time range — so that every signal can lead directly to the next piece of evidence.